Tutorial: How to Use kwb.resilience
Andreas Matzinger
2020-01-09
Source:vignettes/tutorial.Rmd
tutorial.RmdInstall the Package from GitHub
# install.packages("devtools")

remotes::install_github("kwb-r/kwb.resilience", dependencies = TRUE, build_vignettes = TRUE)
note: this will also install two handy KWB packages kwb.event and kwb.plot and their CRAN dependencies.
Define Helper Functions
We use the following plot function within this tutorial to look at our data:
Example Data
Let’s have a look at some example data, which is included in kwb.resilience:
# Show the first lines of the example data
head(oxygen)
#>             timestamp S2_storage_2020 S3_storage_increase S4_red_Imp_Surface
#> 1 2007-04-01 00:00:00           13.73               13.63              13.63
#> 2 2007-04-01 00:15:00           13.71               13.62              13.62
#> 3 2007-04-01 00:30:00           13.70               13.60              13.60
#> 4 2007-04-01 00:45:00           13.69               13.59              13.59
#> 5 2007-04-01 01:00:00           13.67               13.57              13.57
#> 6 2007-04-01 01:15:00           13.66               13.56              13.56
#>   S5_increase_in_DO
#> 1             13.77
#> 2             13.75
#> 3             13.74
#> 4             13.72
#> 5             13.71
#> 6             13.70

# Plot the example data
plot_dissolved_oxygen_S4(oxygen)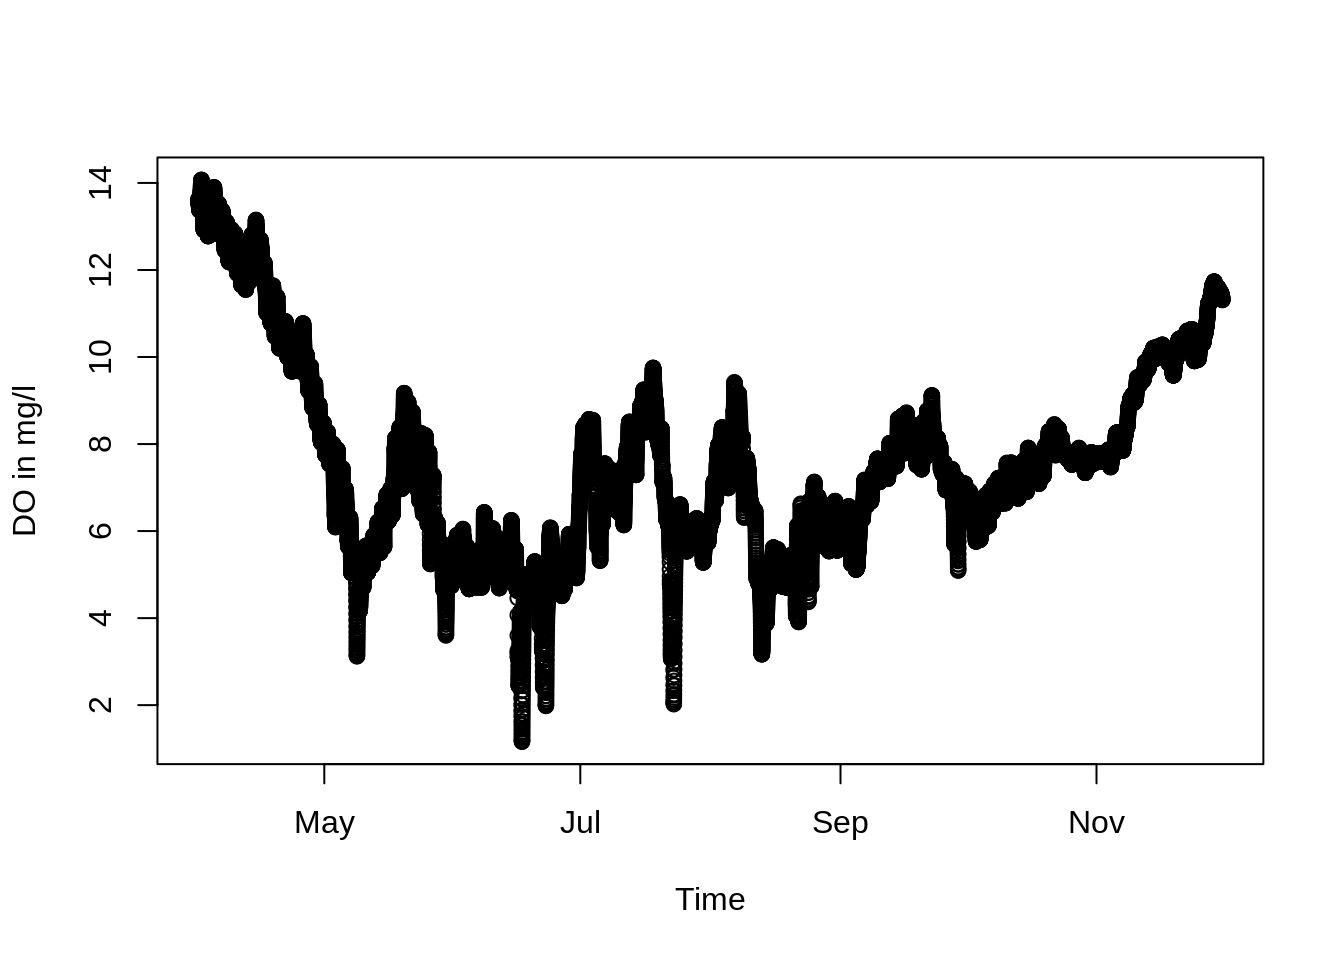
Use the Package
The following sections demonstrate the three main functions of the package:
Severity and Resilience
The function resilience.severity calculates severity as outlined in Matzinger et al. (2018). The following example applies the function for scenario 4 of the test data set, using Pa = 2 mg/L as a lower threshold (for river fish) and Pmax = 0 mg/L as worst possible performance. Note: The function also works for upper thresholds.
Sev.S4 <- resilience.severity(
  time_stamp = oxygen$timestamp,
  Pt = oxygen$S4_red_Imp_Surface,
  Pa = 2,
  Pmax = 0
)

Sev.S4
#> [1] 0.0003069501
The resilience index Res0 can then be calculated as 1-severity:
Resilience Indices Separate for Each Event
A time series can contain several events when performance P(t) violates acceptable threshold Pa. The function resilience.events allows calculation of resilience indices separately for each event. Each line in the resulting data.frame shows one event. Again, let’s make an example for scenario 4:
# Define the acceptable performance
Pa <- 2
# Calculate Events
events.S4 <- resilience.events(
time_stamp = oxygen$timestamp,
Pt = oxygen$S4_red_Imp_Surface,
Pa = Pa,
Pmax = 0,
evtSepTime = 6 * 60 * 60,
signalWidth = 15 * 60
)
events.S4
#> tBeg tEnd dur pBefore pAfter Sev
#> 1 2007-06-16 23:45:00 2007-06-17 05:45:00 22500 NA 479700 0.2963542
#> 2 2007-06-22 19:15:00 2007-06-22 19:45:00 2700 479700 NA 0.0075000
#> Res0 trec trec_percent worst_P
#> 1 0.7036458 10800 48.00000 1.16
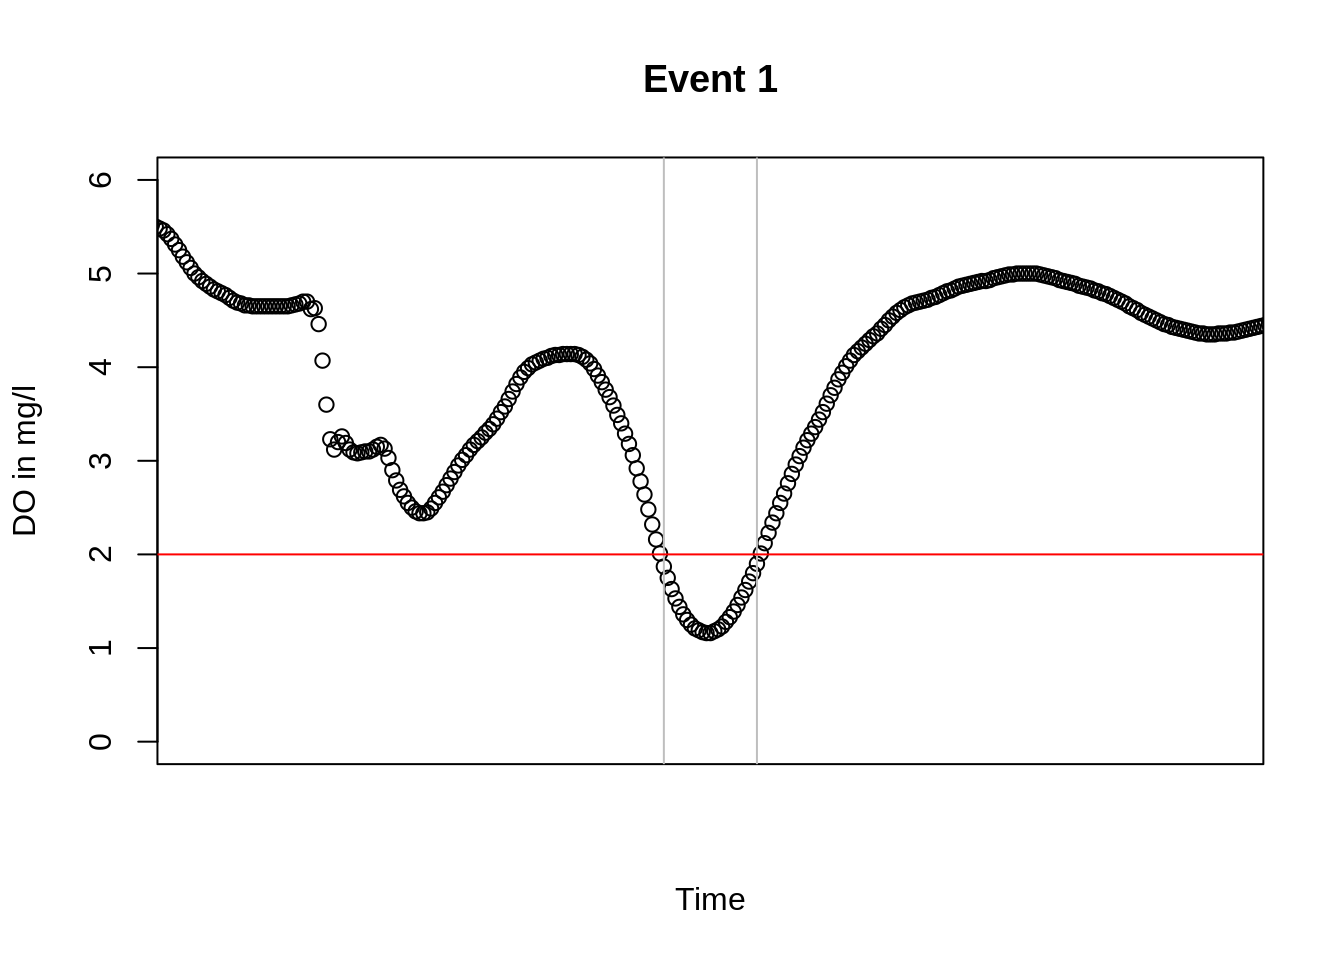
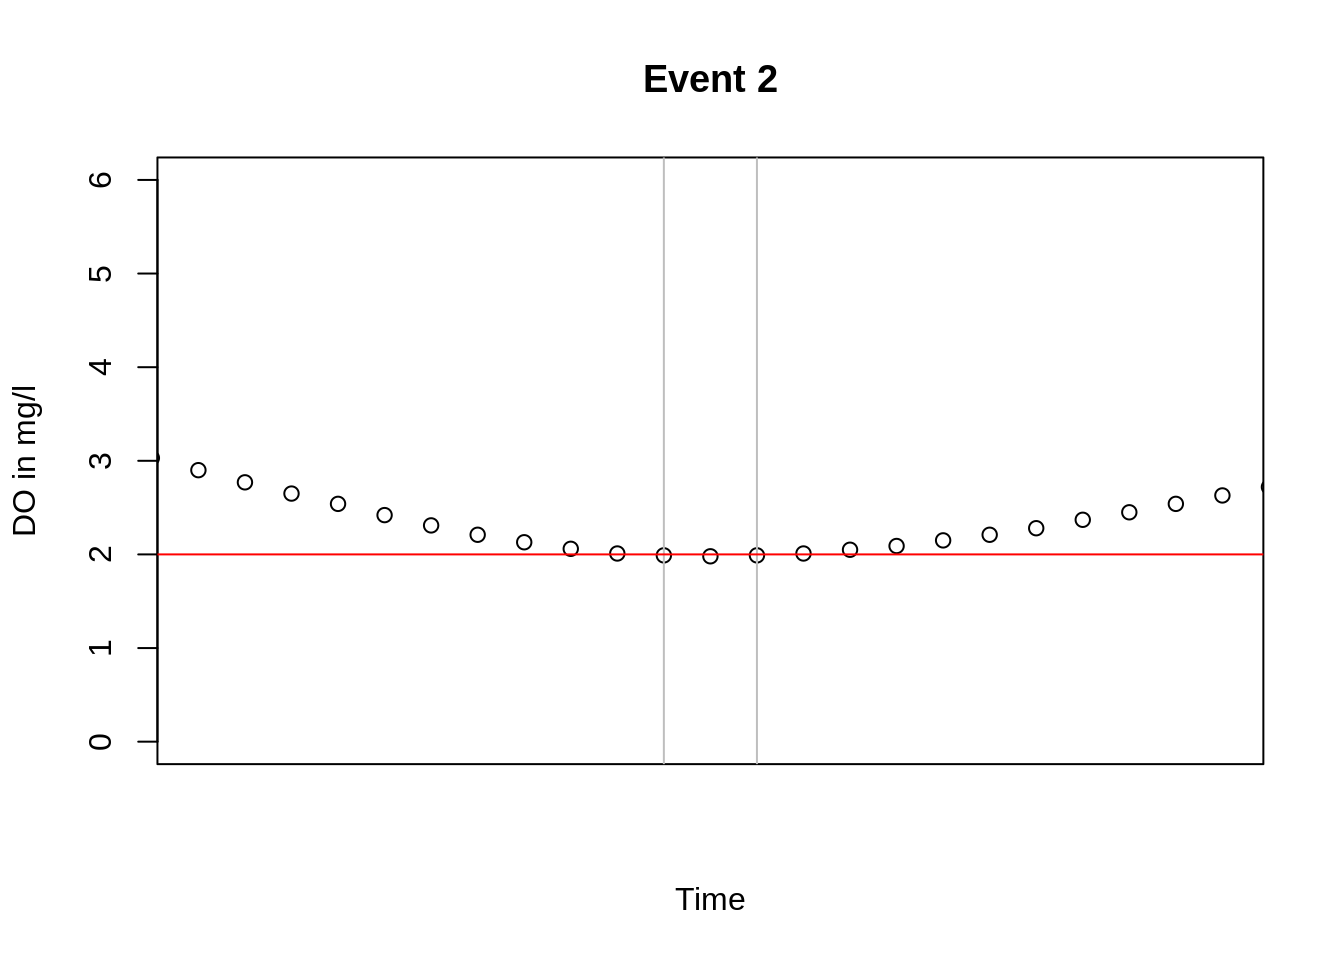
#> 2 0.9925000 900 33.33333 1.98Let’s plot the two failure events of scenario 4 (beginning and end is marked by vertical grey lines). The red line shows Pa = 2 mg/L. For the evaluation of resilience indices severity and Res0, only the area below Pa is integrated (in the case of an upper threshold it would be the area above Pa).
# Plot Events
library(kwb.utils)

for (i in seq_len(nrow(events.S4))) {

  event <- events.S4[i, ]

  xlim <- kwb.utils::extendLimits(kwb.event::eventToXLim(event), 5)

  plot_dissolved_oxygen_S4(oxygen, xlim = xlim, ylim = c(0,6),
                           main = paste("Event", i))

  abline(v = unlist(event[, c("tBeg", "tEnd")]), col = "grey")

  abline(h = Pa, col = "red")

}
Resilience indices for entire time series
The function resi.summary allows calculating resilience indices from Matzinger et al. (2018) for entire time series. The function combines complete integration of time series (e.g., for Res0) with event means (such as mean recovery time in per cent mean_trec_percent). In the case of resilience.summary all the time series (scenarios in test data) are evaluated. Each line of result shows result for one time series:
resi.summary <- resilience.summary(
  time_stamp = oxygen$timestamp,
  Pt = oxygen[, setdiff(names(oxygen), "timestamp")],
  Pa = 2,
  Pmax = 0,
  evtSepTime = 6 * 60 * 60,
  signalWidth = 15 * 60
)

resi.summary
#>   time_series num_events worst_P total_dur total_trec mean_trec_percent
#> 1           1          4    0.45     77400      37800          49.81982
#> 2           2          4    0.46     71100      35100          47.97619
#> 3           3          2    1.16     25200      11700          40.66667
#> 4           4          3    1.09     41400      19800          46.09195
#>            Sev      Res0
#> 1 0.0014203381 0.9985797
#> 2 0.0011772114 0.9988228
#> 3 0.0003069501 0.9996930
#> 4 0.0004192281 0.9995808