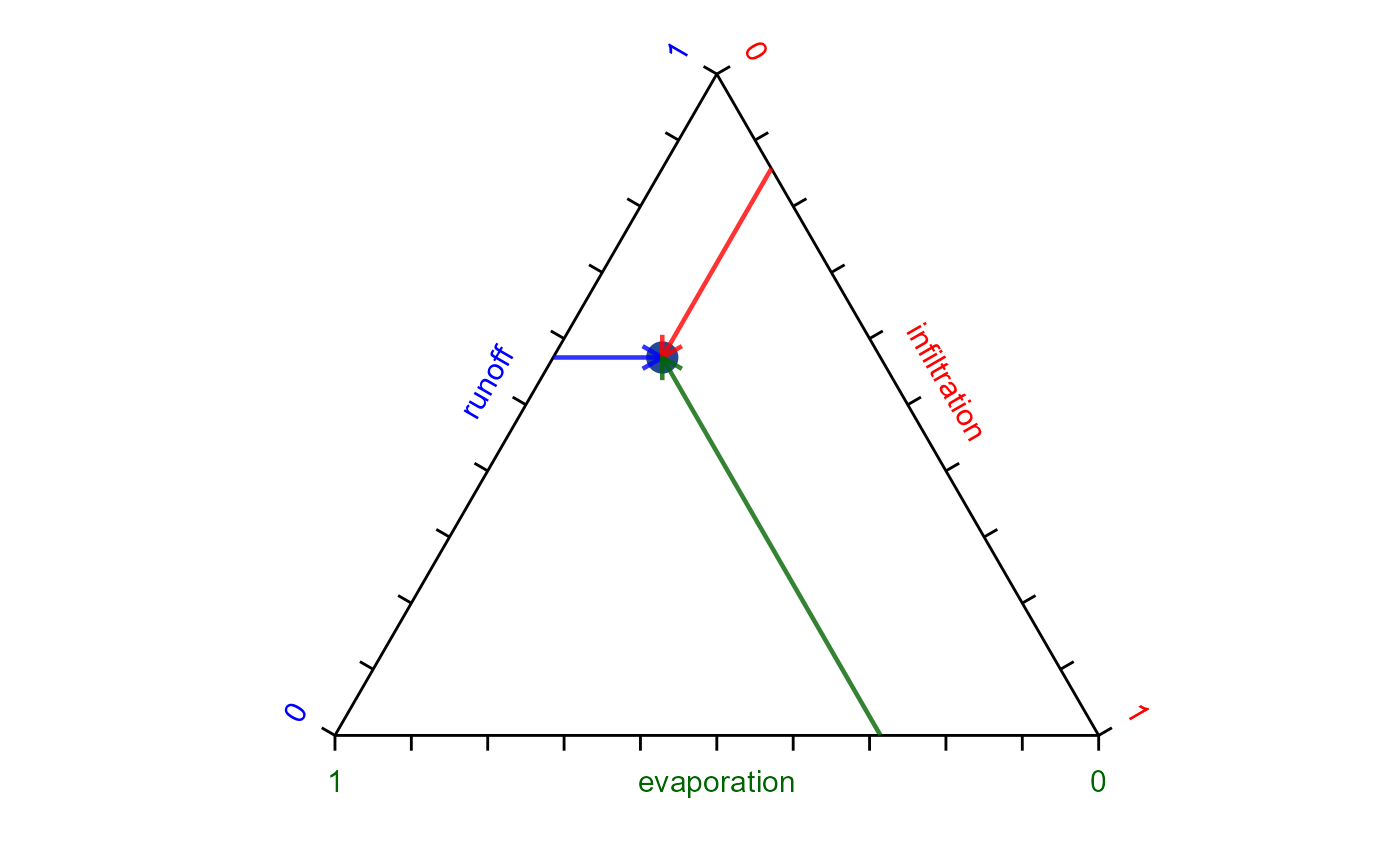
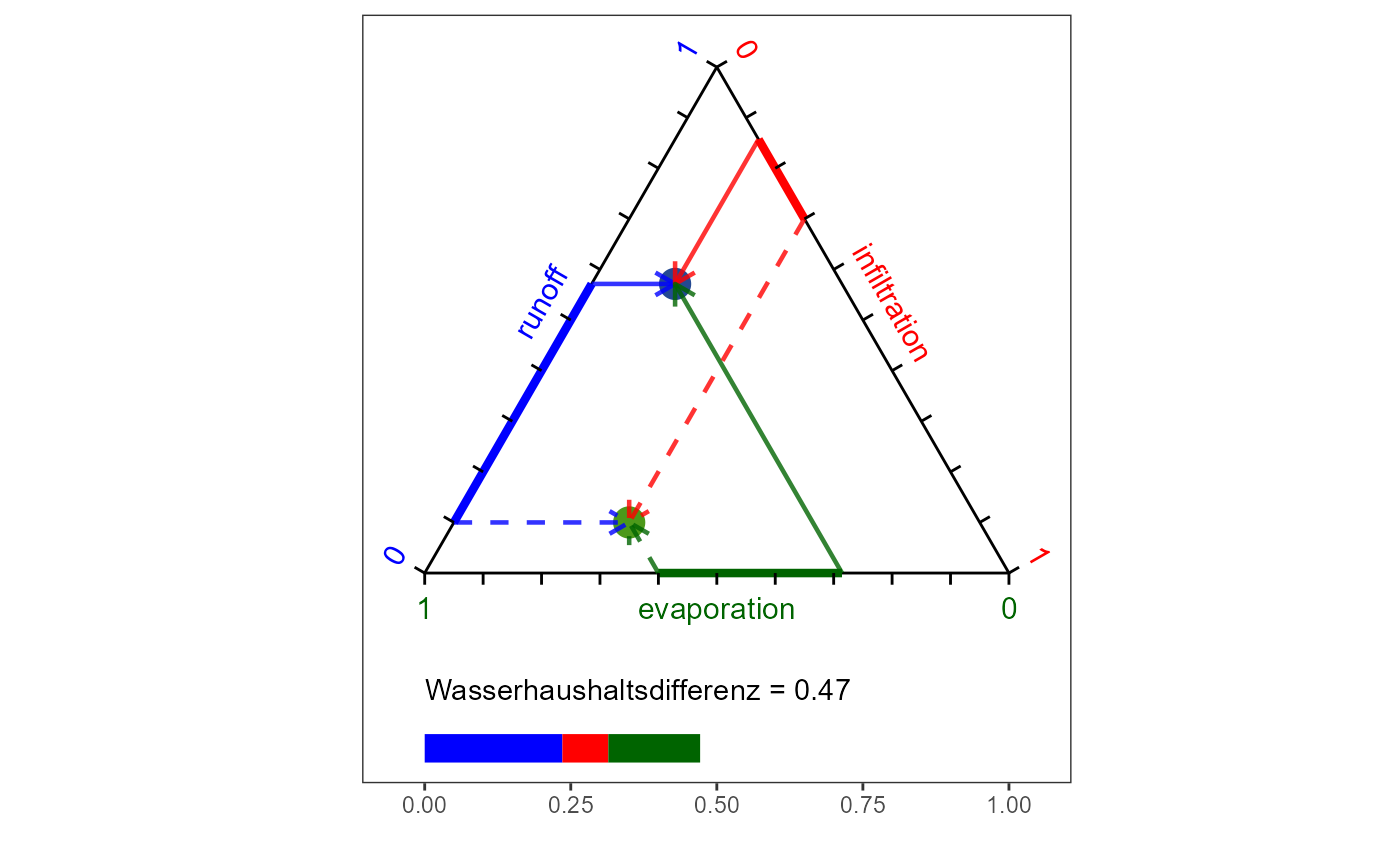
Plot Triangle of Three Fractions
Usage
triangle_of_fractions(
  fractions,
  fractions_2 = NULL,
  cols = c("blue", "red", "darkgreen")
)
Arguments
- fractions
numeric vector with three values having a sum of one. The names of the vector elements are used as labels
- fractions_2
optional. Similar to
fractions. If given, these fractions are shown as dashed lines in the plot and the "deltas" betweenfractionsandfractions_2are shown as horizontally stacked bars below the triangle.- cols
vector of length three giving the colour names