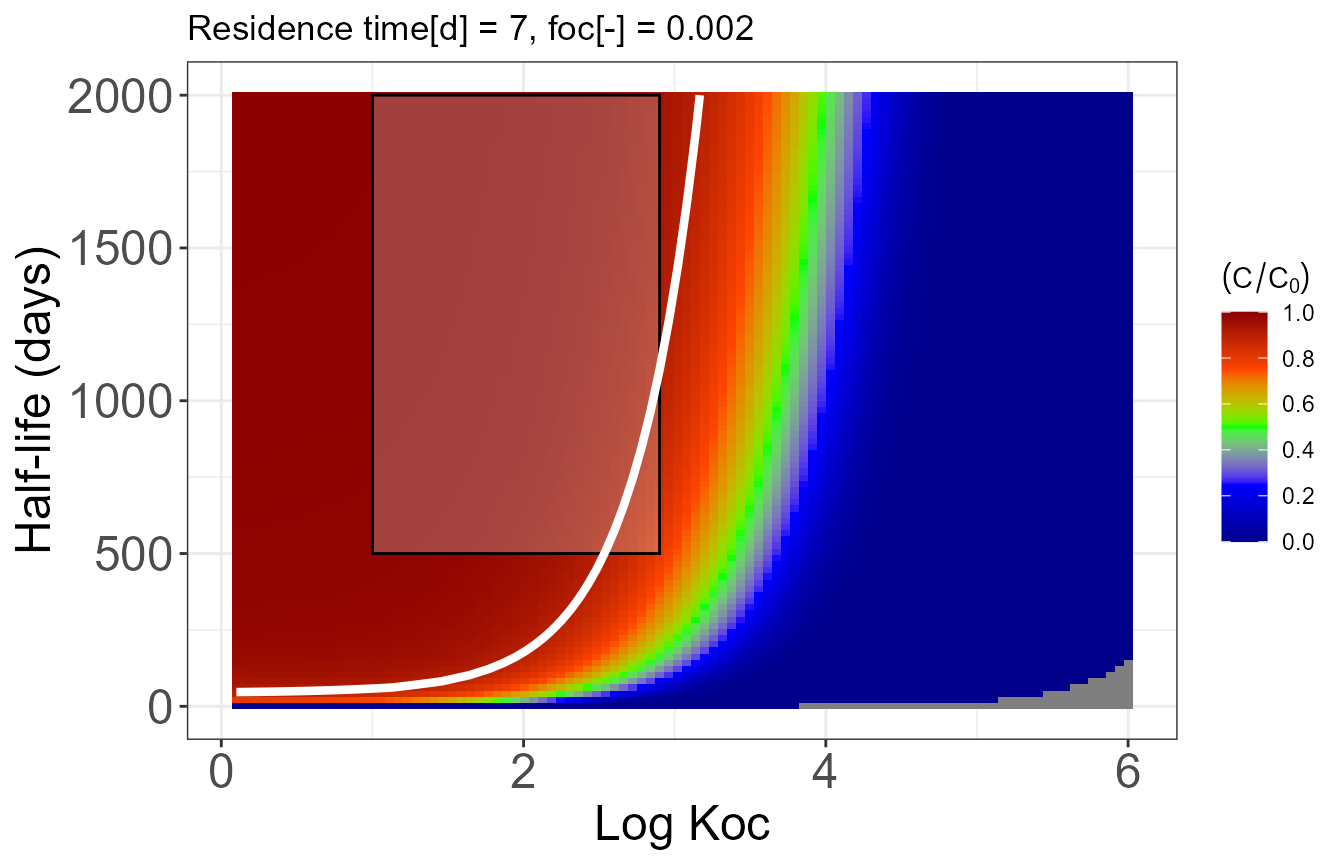
Budapest Tahi
bear1d_tahi_combined <- kwb.1dbear::calculate_bear1d(
  n_values = 0.3,
  rs_values = 2.7,
  foc_values = 0.002,
  log_koc_values = c(1, 2.9),
  hl_values = c(500, 2000),
  D_values = 10,
  v_values = 2.14,
  t_values = seq(0, 700, by = 1),
  x_values = 60
)

# Combine the plots
tahi_combined <- kwb.1dbear::plot_combined(bear1d_tahi_combined)

print(tahi_combined$plot)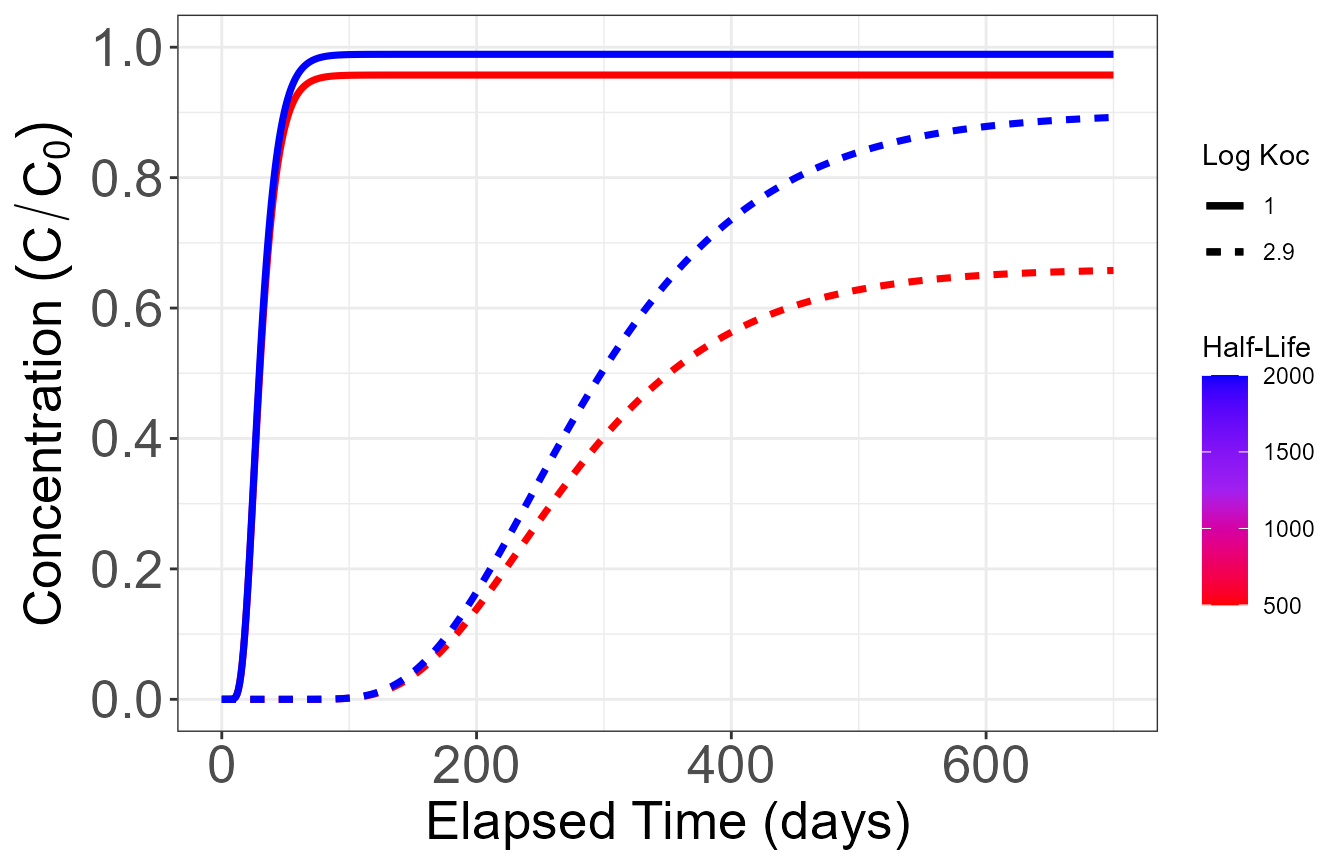
# Generate heat map
log_koc_values <- seq(0.1, 6, length.out = 100)
hl_values <- seq(1, 2000, length.out = 100)


bear1d_tahi_heatmap <- kwb.1dbear::calculate_bear1d(
  n_values = 0.3,
  rs_values = 2.7,
  foc_values = 0.002,
  log_koc_values = log_koc_values,
  hl_values = hl_values,
  D_values = 10,
  v_values = 2.14,
  x_values = 60
)

print(kwb.1dbear::plot_heatmap(bear1d_tahi_heatmap,
                               rect_data = tahi_combined$rect_data,
                               measured_C_C0 = 0.73))
#> Warning: Removed 14 rows containing non-finite outside the scale range
#> (`stat_contour()`).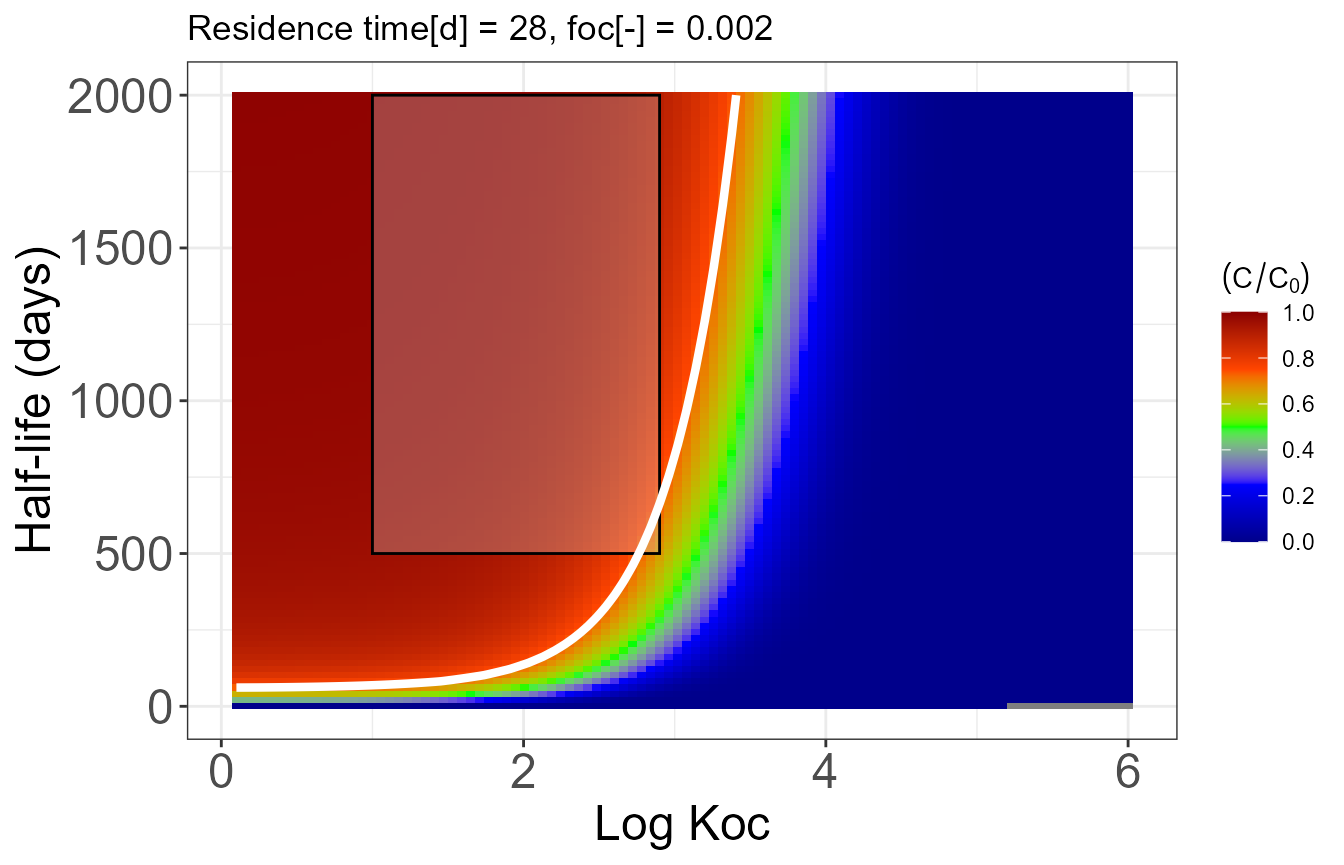
Budapest Surany
bear1d_surany_combined <- kwb.1dbear::calculate_bear1d(
  n_values = 0.3,
  rs_values = 2.7,
  foc_values = 0.002,
  log_koc_values = c(1, 1.9),
  hl_values = c(500, 2000),
  D_values = 10,
  v_values = 1.38,
  t_values = seq(0, 700, by = 1),
  x_values = 228
)

# Combine the plots
surany_combined <- kwb.1dbear::plot_combined(bear1d_surany_combined)

print(surany_combined$plot)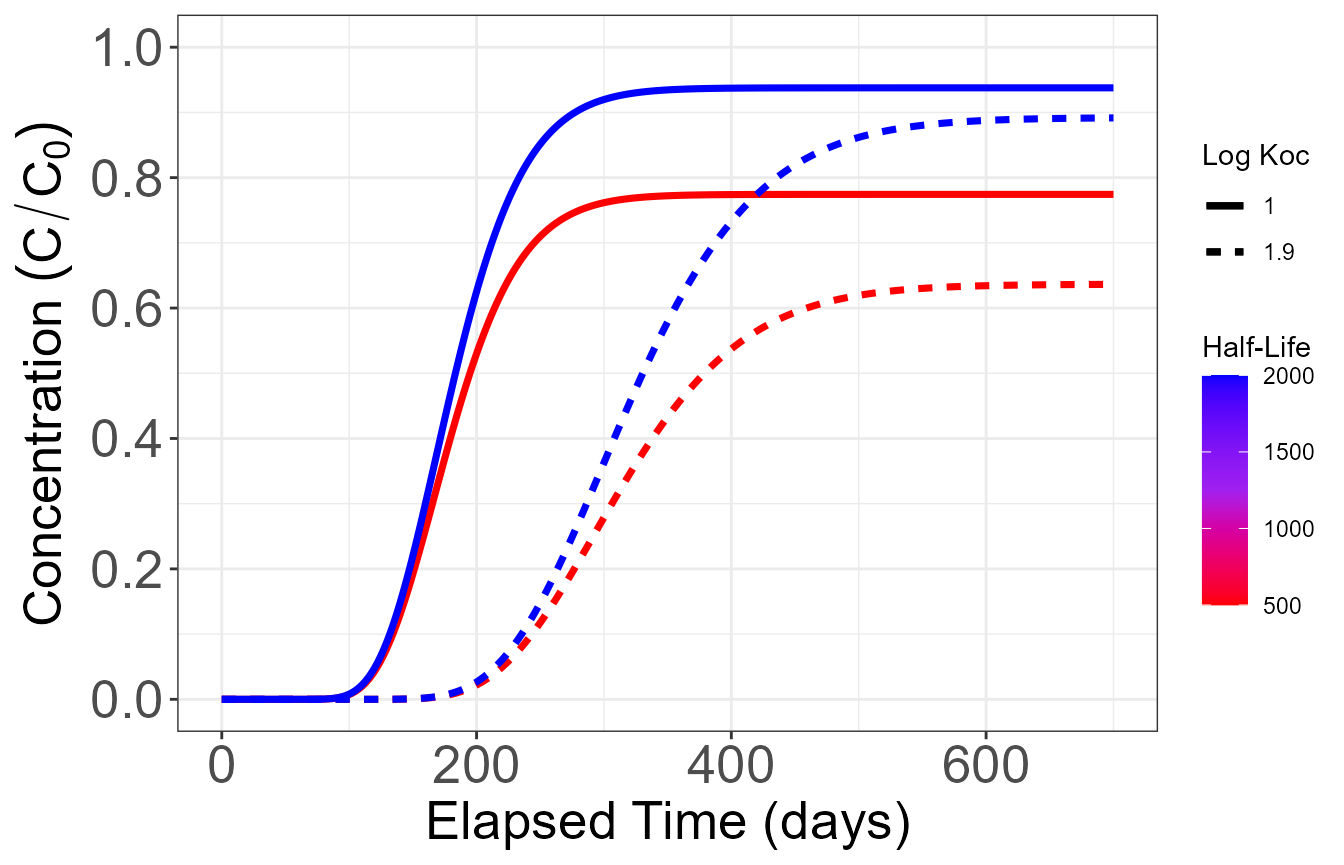
# Generate heat map
bear1d_surany_heatmap <- kwb.1dbear::calculate_bear1d(
  n_values = 0.3,
  rs_values = 2.7,
  foc_values = 0.002,
  log_koc_values = seq(0.1, 6, length.out = 100),
  hl_values = seq(1, 2000, length.out = 100),
  D_values = 10,
  v_values = 1.38,
  x_values = 228
)

print(kwb.1dbear::plot_heatmap(bear1d_surany_heatmap,
                               rect_data = surany_combined$rect_data,
                               measured_C_C0 = 0.8))
#> Warning: Removed 58 rows containing non-finite outside the scale range
#> (`stat_contour()`).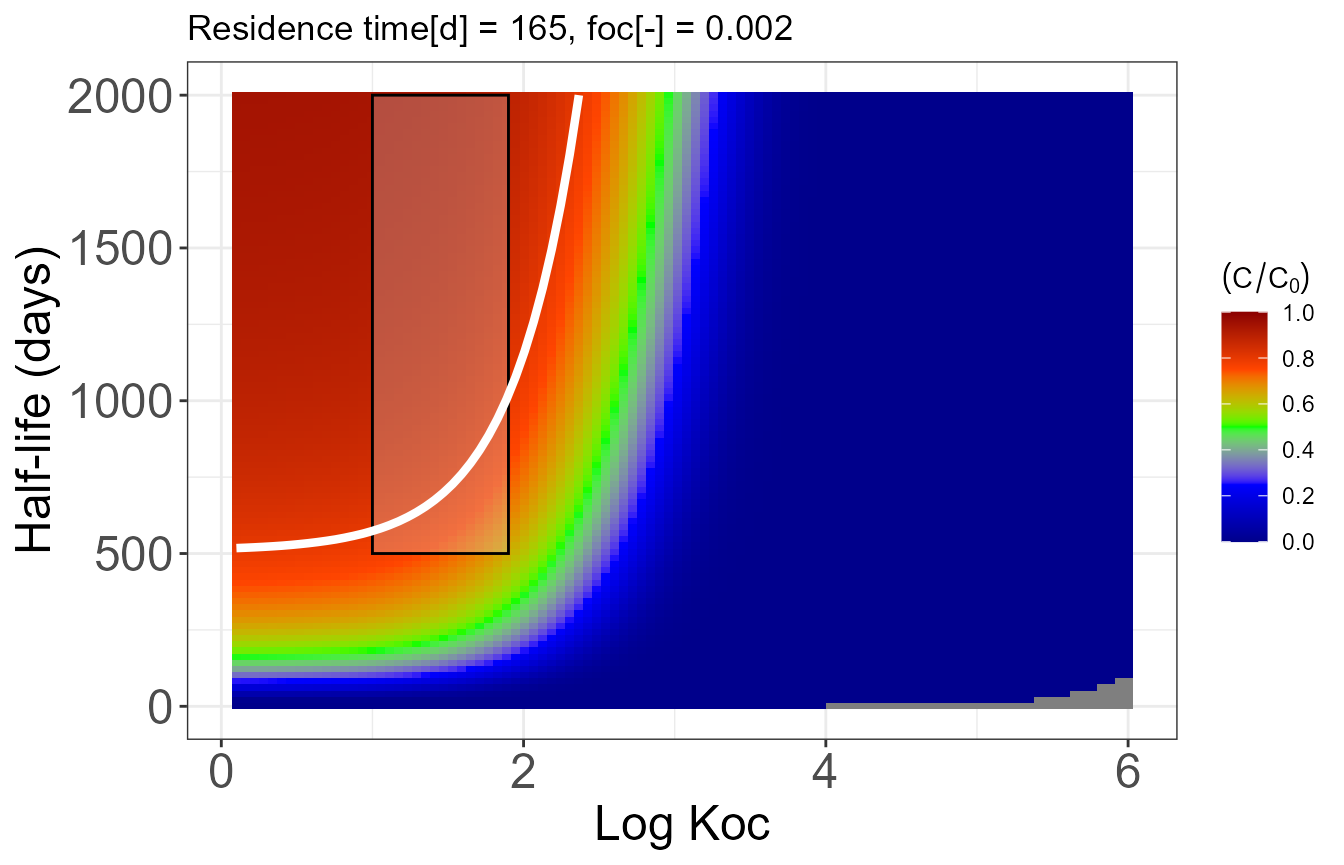
Vienna
bear1d_vienna_combined <- kwb.1dbear::calculate_bear1d(
  n_values = 0.15,
  rs_values = 2.7,
  foc_values = 0.002,
  log_koc_values = c(1, 2.9),
  hl_values = c(500, 2000),
  D_values = 10,
  v_values = 21.3,
  t_values = seq(0, 400, by = 1),
  x_values = 141
)

# Combine the plots
vienna_combined <- kwb.1dbear::plot_combined(bear1d_vienna_combined)

print(vienna_combined$plot)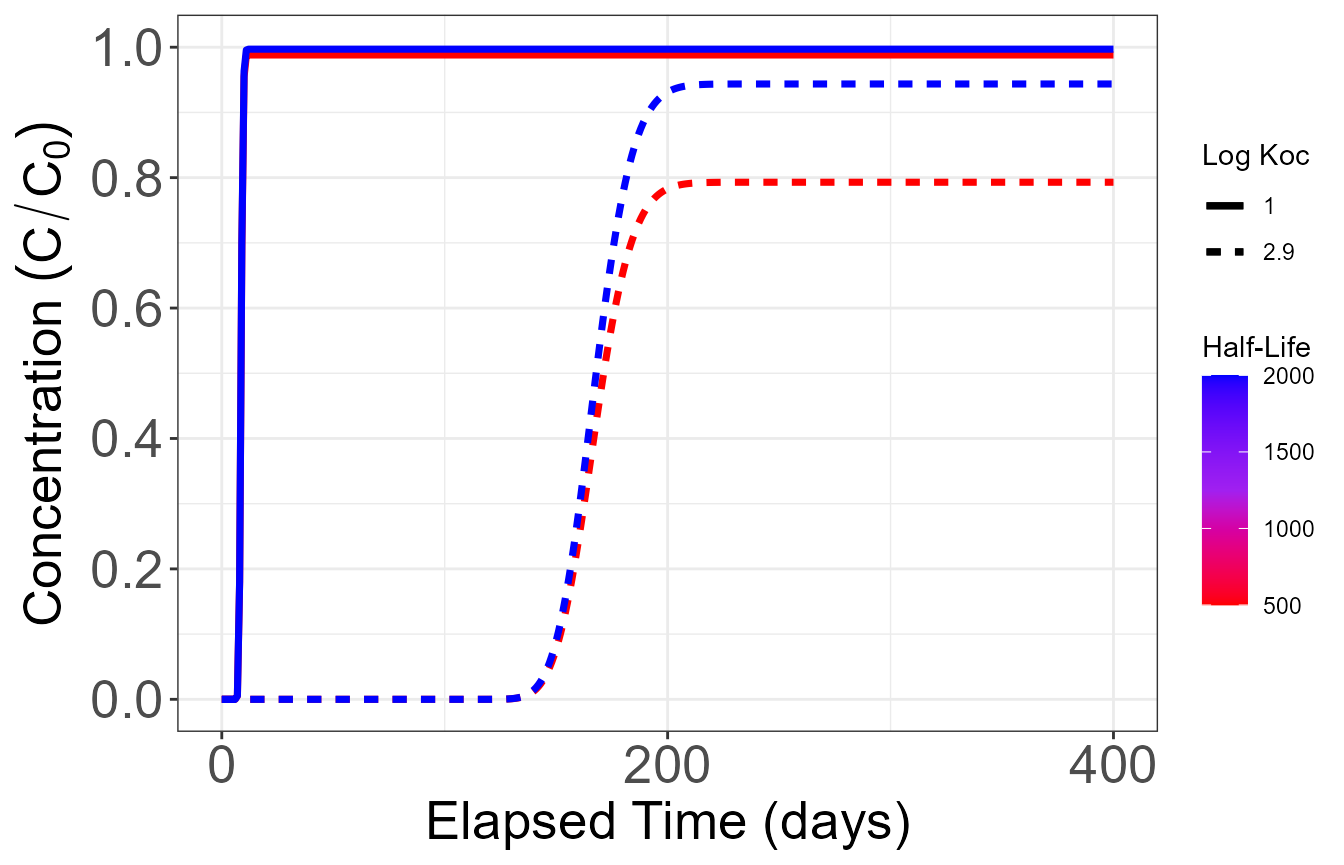
# Generate heat map
bear1d_vienna_heatmap <- kwb.1dbear::calculate_bear1d(
  n_values = 0.15,
  rs_values = 2.7,
  foc_values = 0.002,
  log_koc_values = seq(0.1, 6, length.out = 100),
  hl_values = seq(1, 2000, length.out = 100),
  D_values = 10,
  v_values = 21.3,
  x_values = 141
)

print(kwb.1dbear::plot_heatmap(bear1d_vienna_heatmap,
                               rect_data = vienna_combined$rect_data,
                               measured_C_C0 = 0.9))
#> Warning: Removed 80 rows containing non-finite outside the scale range
#> (`stat_contour()`).