Plot results
Arguments
- grouped_data
data.frame with grouped rawdata as retrieved by function group_data()
- x_col
column name to be used for plotting on x-axis (default: "model")
- y_col
column name to be used for plotting on y-axis (default: "quantity_sum")
- fill_col
column name to be used for filling (default: "process")
Examples
zipfile <- system.file("extdata/umberto-nxt_v7.1.0.13.503/Beispiel_Auswertung.zip",
package = "kwb.umberto")
umberto7_csv_dir <- file.path(tempdir(), "Beispiel_Auswertung")
unzip(zipfile, exdir = umberto7_csv_dir)
umberto7_rawdata <- kwb.umberto::import_rawdata(csv_dir = umberto7_csv_dir)
#> Importing csv file 'C:\Users\RUNNER~1\AppData\Local\Temp\RtmpgX0H5o/Beispiel_Auswertung/Ref_High_C+N.csv'
#> ℹ Using "','" as decimal and "'.'" as grouping mark. Use `read_delim()` for more control.
#> Rows: 19996 Columns: 12
#> ── Column specification ────────────────────────────────────────────────────────
#> Delimiter: ";"
#> chr (11): Project, Model, Net, Timestamp, Product, LCI Method, Phase, Proces...
#> dbl (1): Quantity
#>
#> ℹ Use `spec()` to retrieve the full column specification for this data.
#> ℹ Specify the column types or set `show_col_types = FALSE` to quiet this message.
#> Importing csv file 'C:\Users\RUNNER~1\AppData\Local\Temp\RtmpgX0H5o/Beispiel_Auswertung/Ref_High_C+high N.csv'
#> ℹ Using "','" as decimal and "'.'" as grouping mark. Use `read_delim()` for more control.
#> Rows: 19996 Columns: 12
#> ── Column specification ────────────────────────────────────────────────────────
#> Delimiter: ";"
#> chr (11): Project, Model, Net, Timestamp, Product, LCI Method, Phase, Proces...
#> dbl (1): Quantity
#>
#> ℹ Use `spec()` to retrieve the full column specification for this data.
#> ℹ Specify the column types or set `show_col_types = FALSE` to quiet this message.
#> Importing csv file 'C:\Users\RUNNER~1\AppData\Local\Temp\RtmpgX0H5o/Beispiel_Auswertung/Ref_Low_C+N.csv'
#> ℹ Using "','" as decimal and "'.'" as grouping mark. Use `read_delim()` for more control.
#> Rows: 19996 Columns: 12
#> ── Column specification ────────────────────────────────────────────────────────
#> Delimiter: ";"
#> chr (11): Project, Model, Net, Timestamp, Product, LCI Method, Phase, Proces...
#> dbl (1): Quantity
#>
#> ℹ Use `spec()` to retrieve the full column specification for this data.
#> ℹ Specify the column types or set `show_col_types = FALSE` to quiet this message.
#> Importing csv file 'C:\Users\RUNNER~1\AppData\Local\Temp\RtmpgX0H5o/Beispiel_Auswertung/Ref_Low_C+high N.csv'
#> ℹ Using "','" as decimal and "'.'" as grouping mark. Use `read_delim()` for more control.
#> Rows: 19996 Columns: 12
#> ── Column specification ────────────────────────────────────────────────────────
#> Delimiter: ";"
#> chr (11): Project, Model, Net, Timestamp, Product, LCI Method, Phase, Proces...
#> dbl (1): Quantity
#>
#> ℹ Use `spec()` to retrieve the full column specification for this data.
#> ℹ Specify the column types or set `show_col_types = FALSE` to quiet this message.
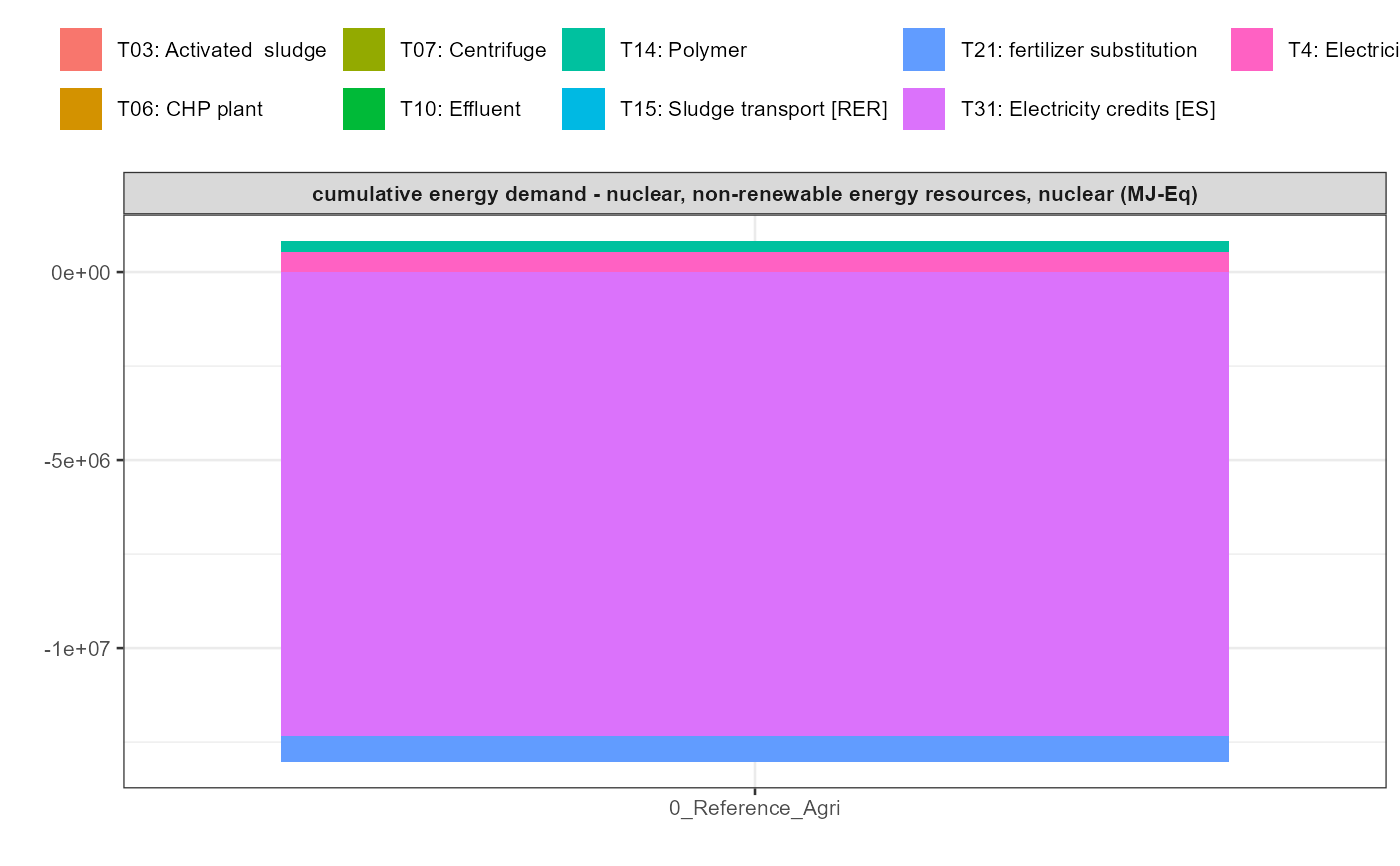
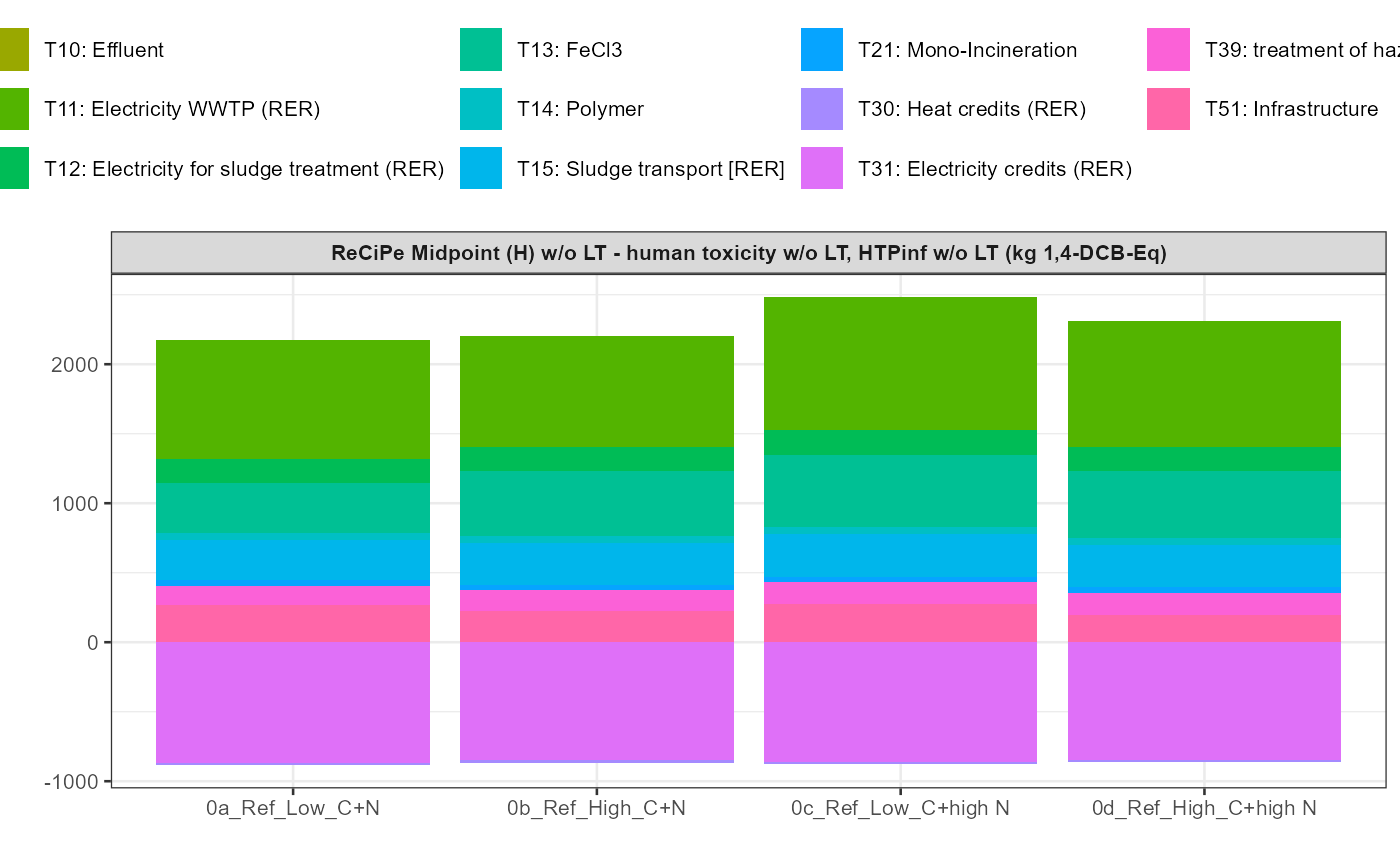
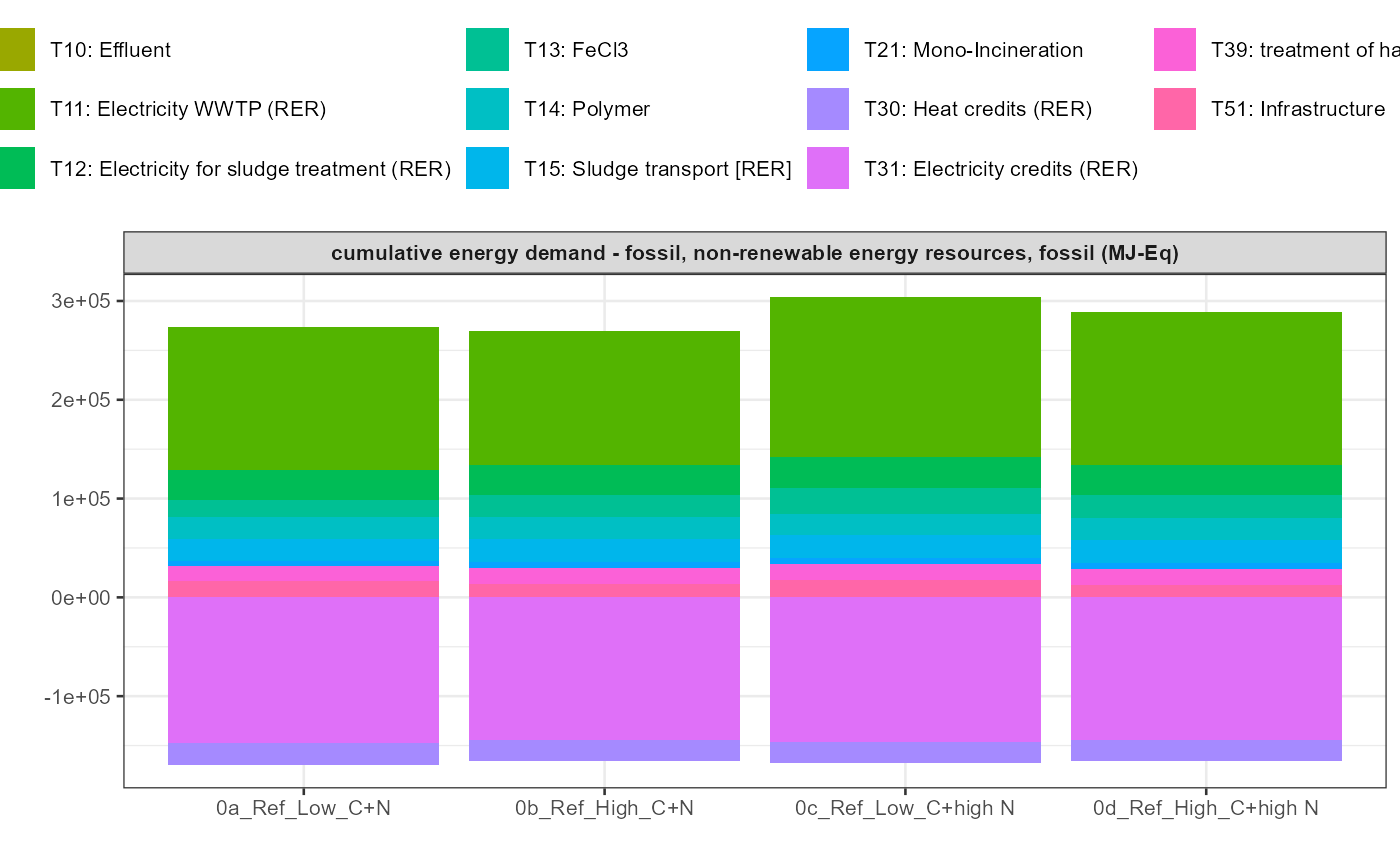
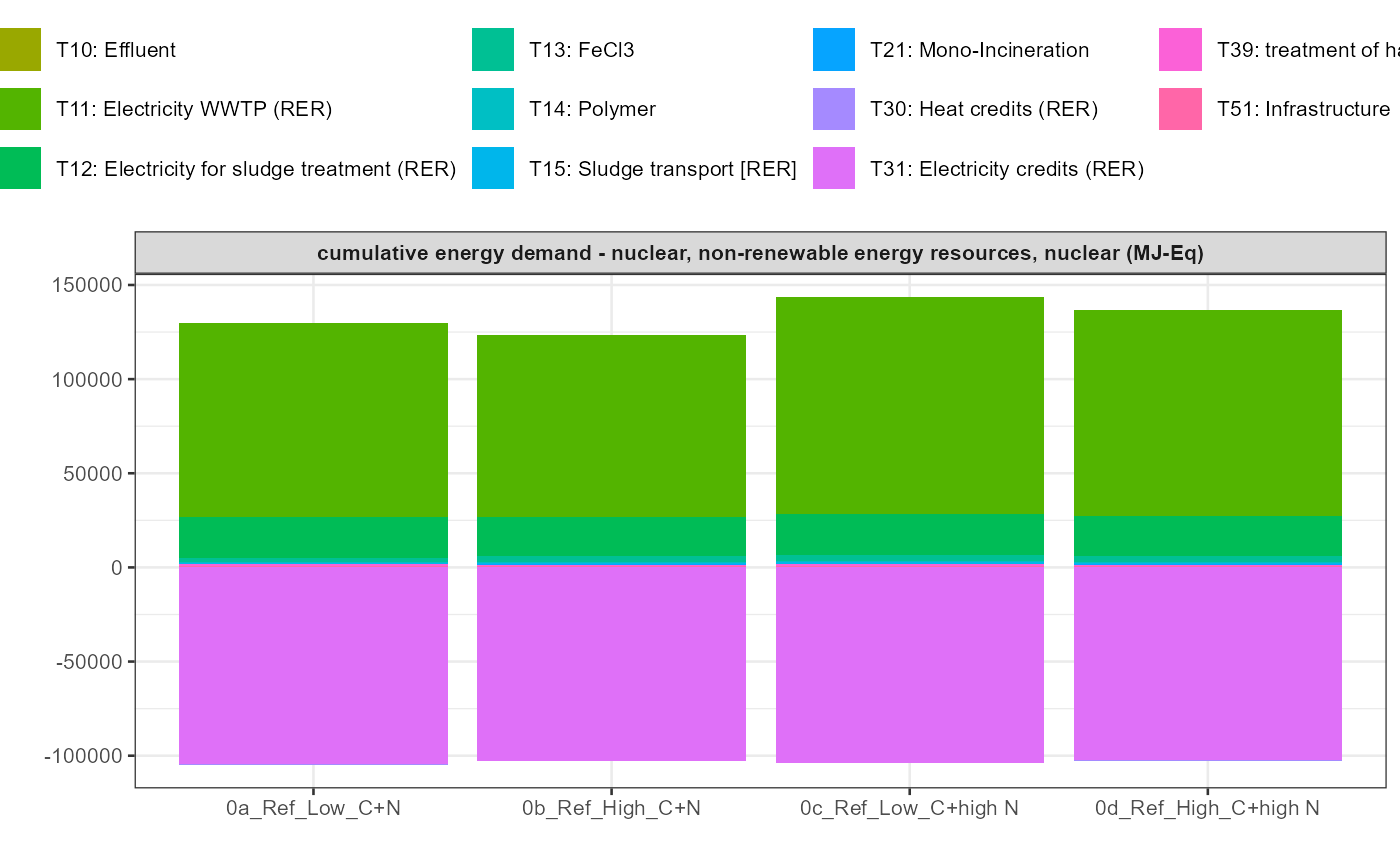
umberto7_data_grouped <- kwb.umberto::group_data(umberto7_rawdata)
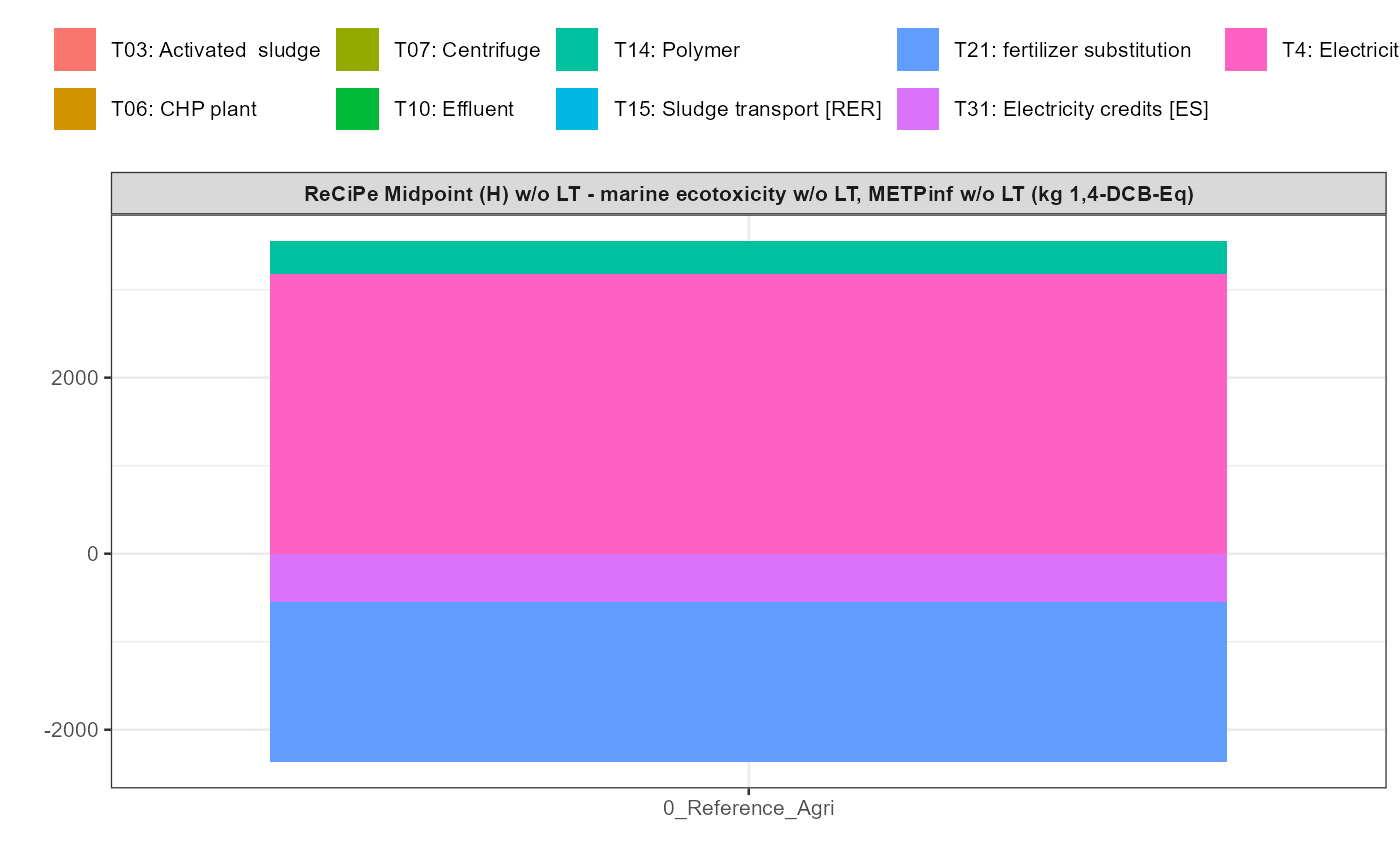
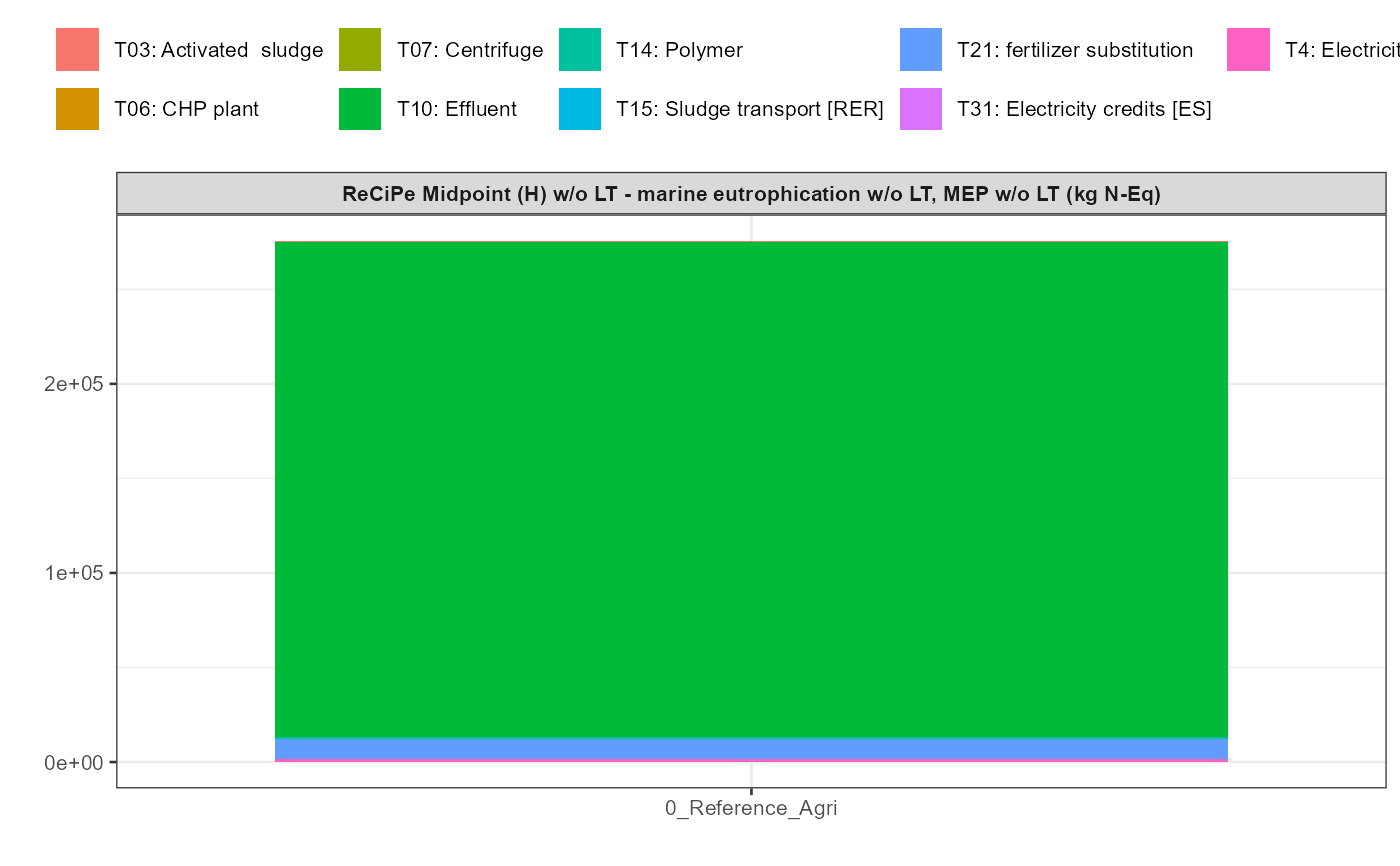
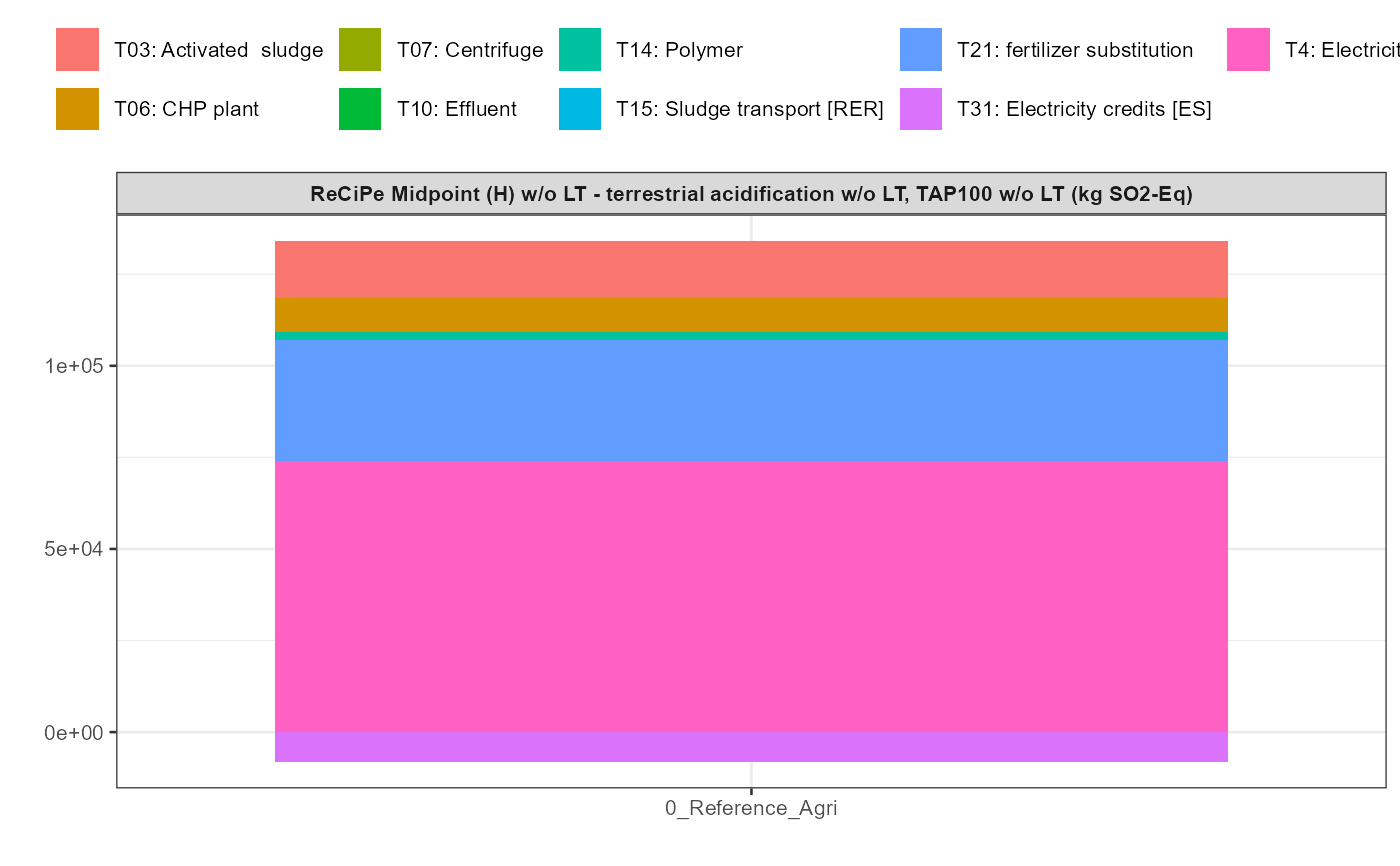
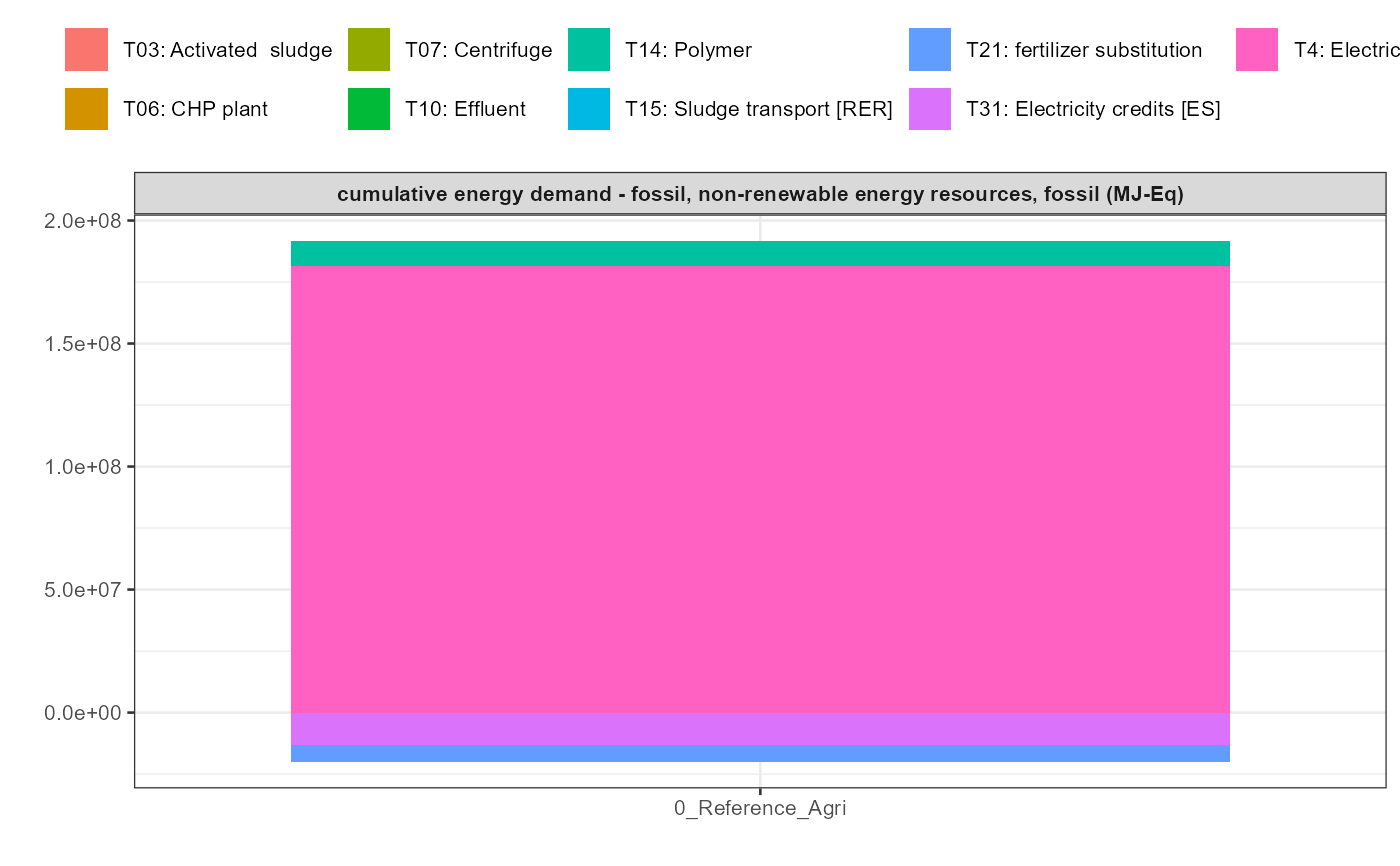
kwb.umberto::plot_results(grouped_data = umberto7_data_grouped)
 umberto10_csv_dir <- system.file("extdata/umberto-lca+_v10.1.0.3.146",
package = "kwb.umberto")
umberto10_rawdata <- kwb.umberto::import_rawdata(csv_dir = umberto10_csv_dir)
#> Importing csv file 'D:/a/_temp/Library/kwb.umberto/extdata/umberto-lca+_v10.1.0.3.146/smartech2_model-v0.1.0_input-v0.3.1.csv'
#> ℹ Using "','" as decimal and "'.'" as grouping mark. Use `read_delim()` for more control.
#> Rows: 8456 Columns: 15
#> ── Column specification ────────────────────────────────────────────────────────
#> Delimiter: ";"
#> chr (14): Project, Model, Net, Timestamp, Product, Product Name, Product Arr...
#> dbl (1): Quantity
#>
#> ℹ Use `spec()` to retrieve the full column specification for this data.
#> ℹ Specify the column types or set `show_col_types = FALSE` to quiet this message.
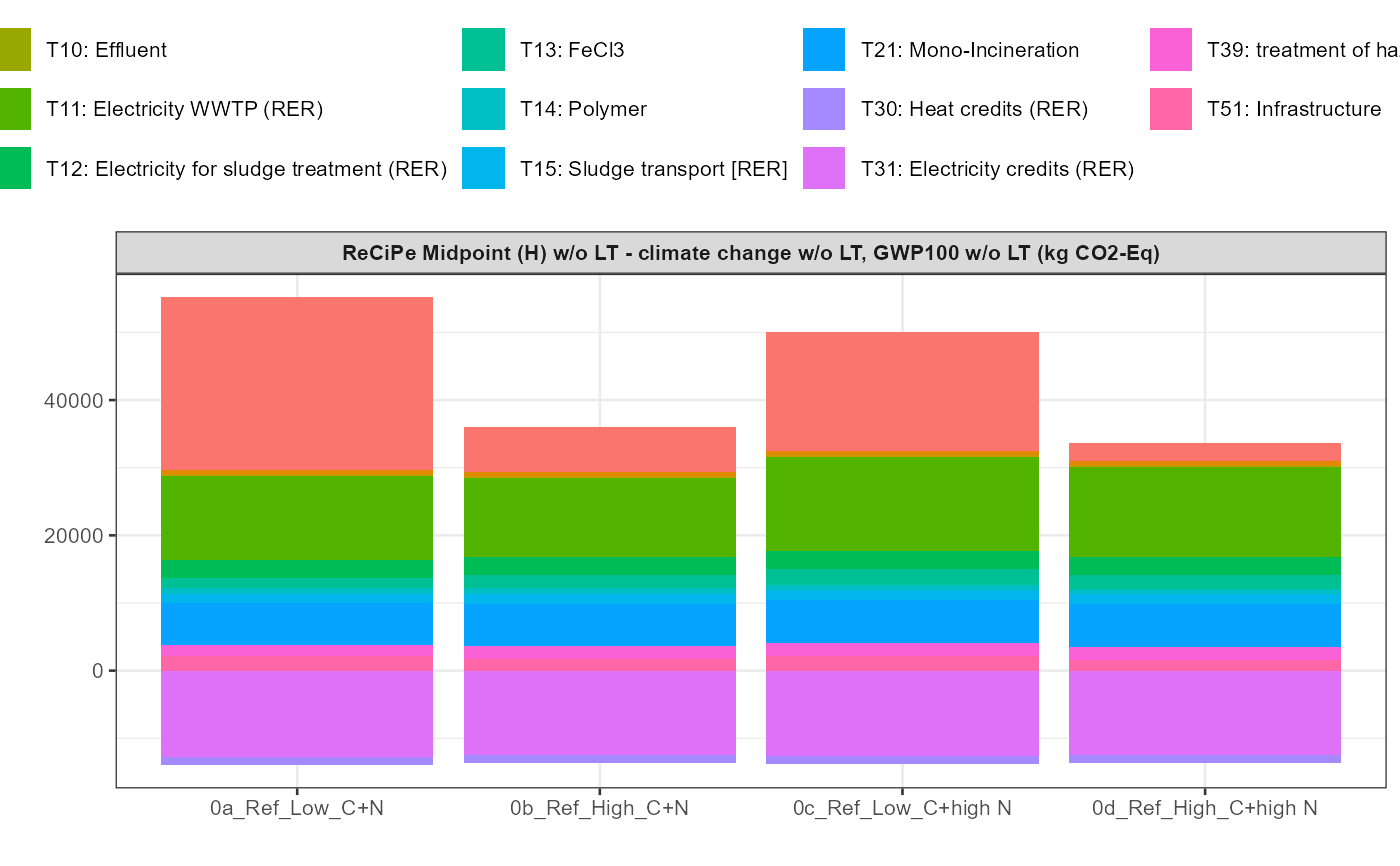
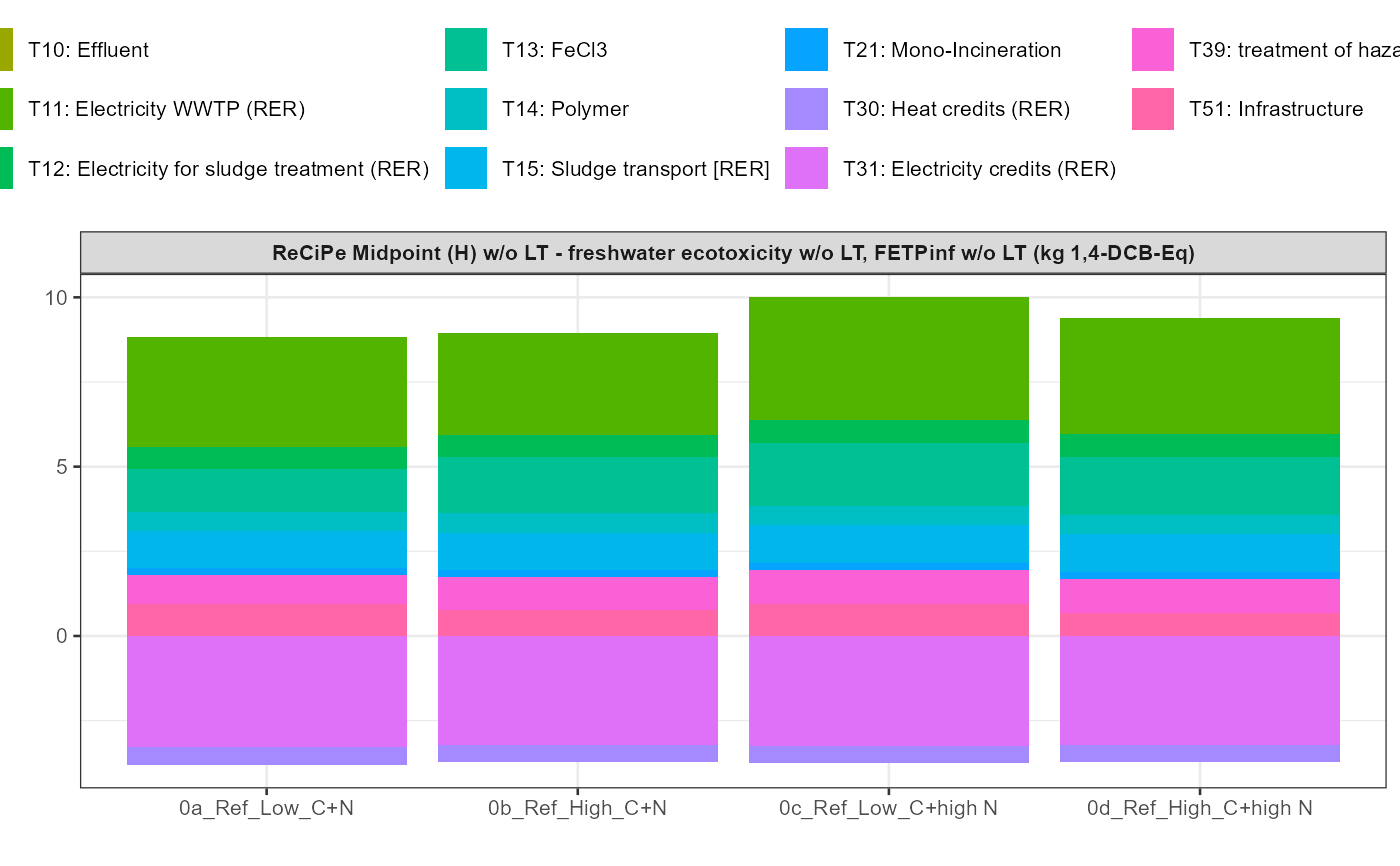
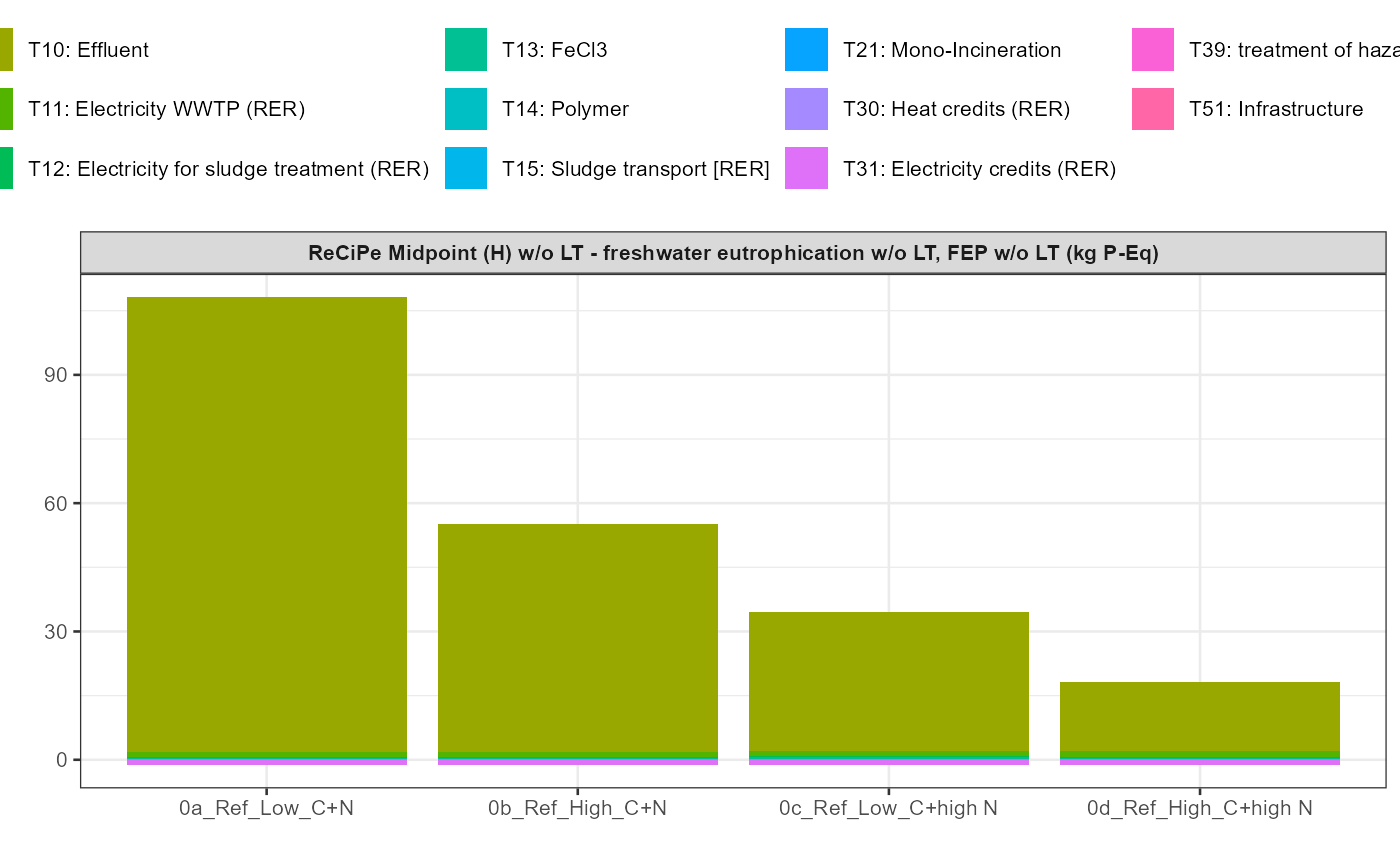
umberto10_data_grouped <- kwb.umberto::group_data(umberto10_rawdata)
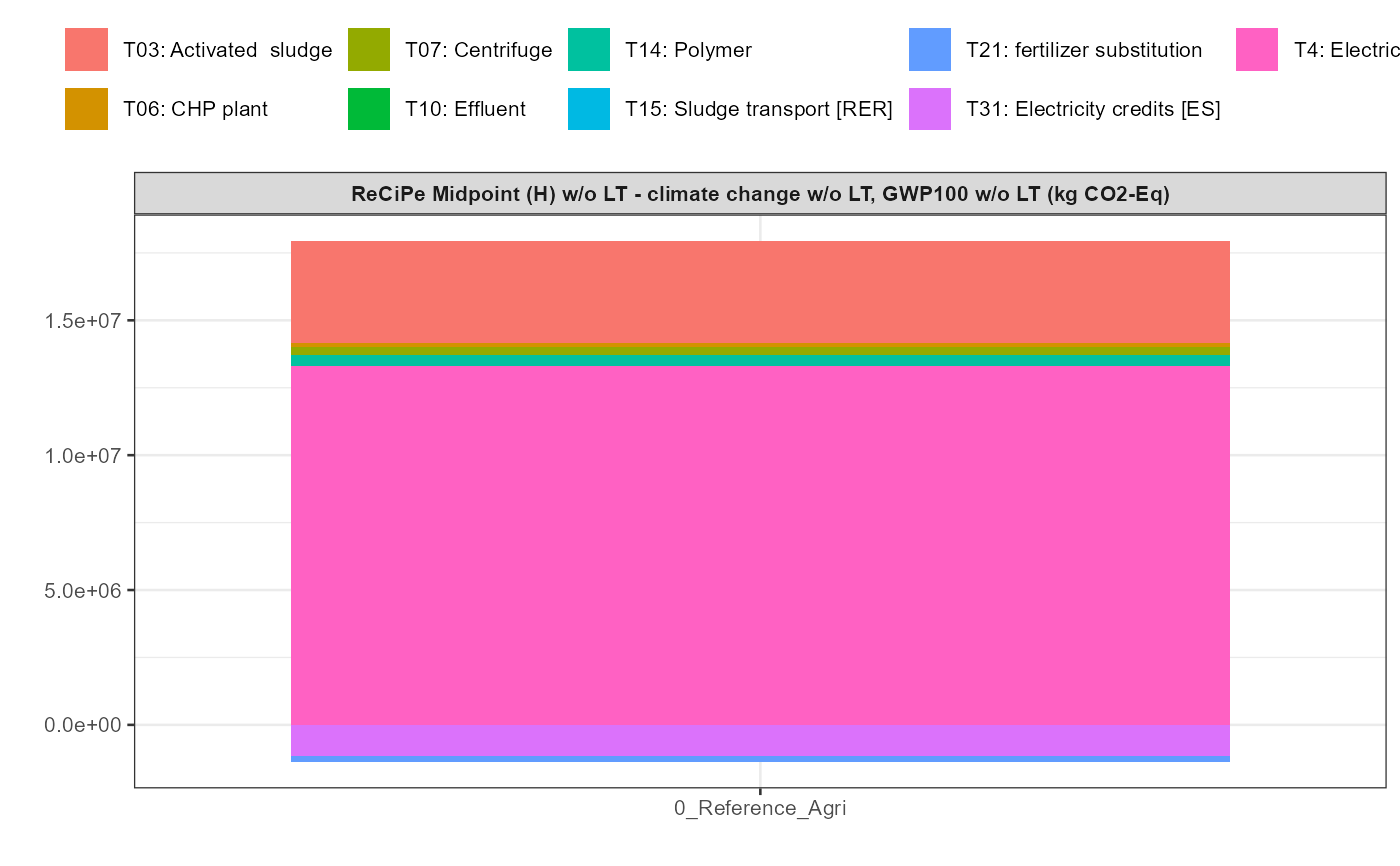
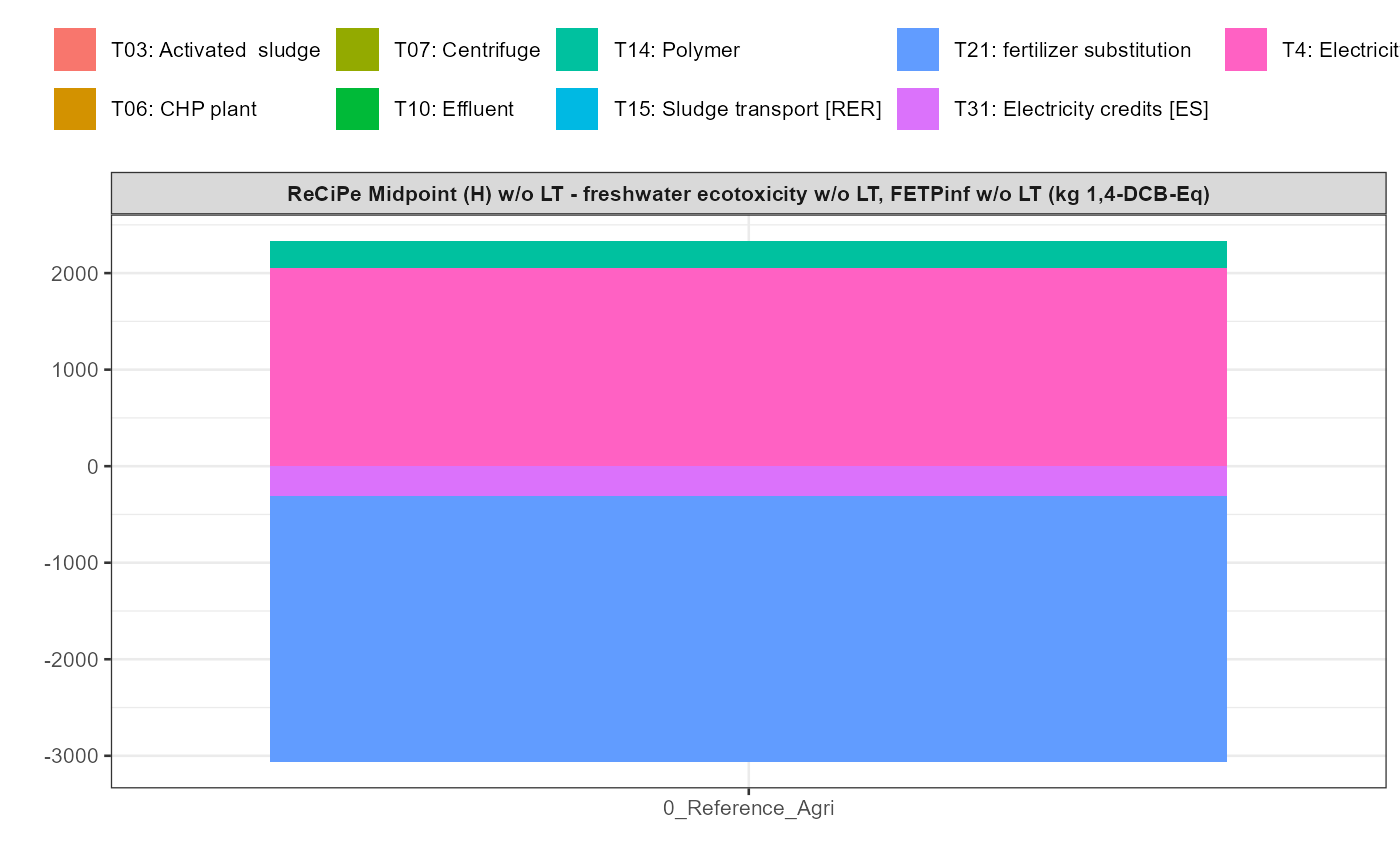
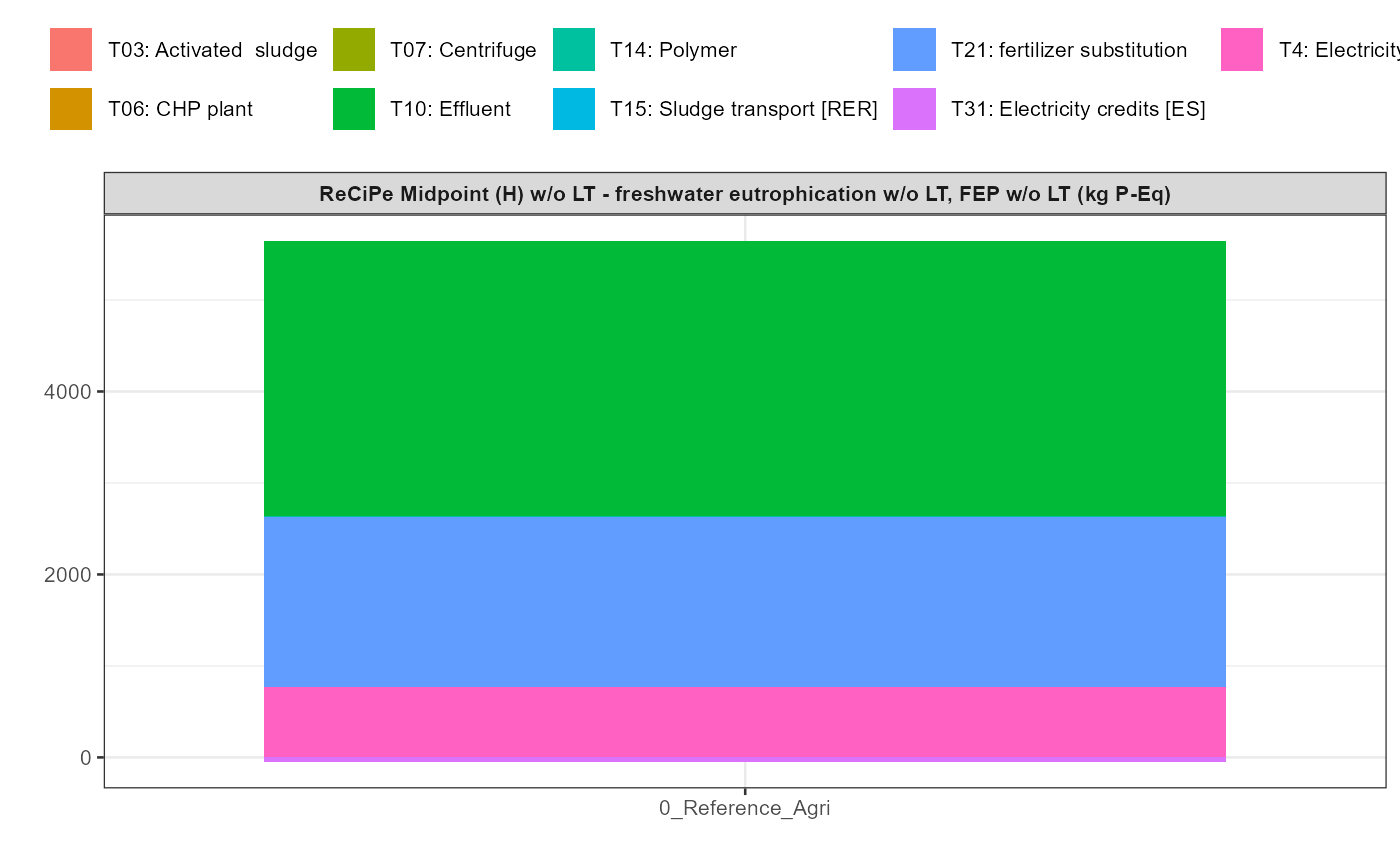
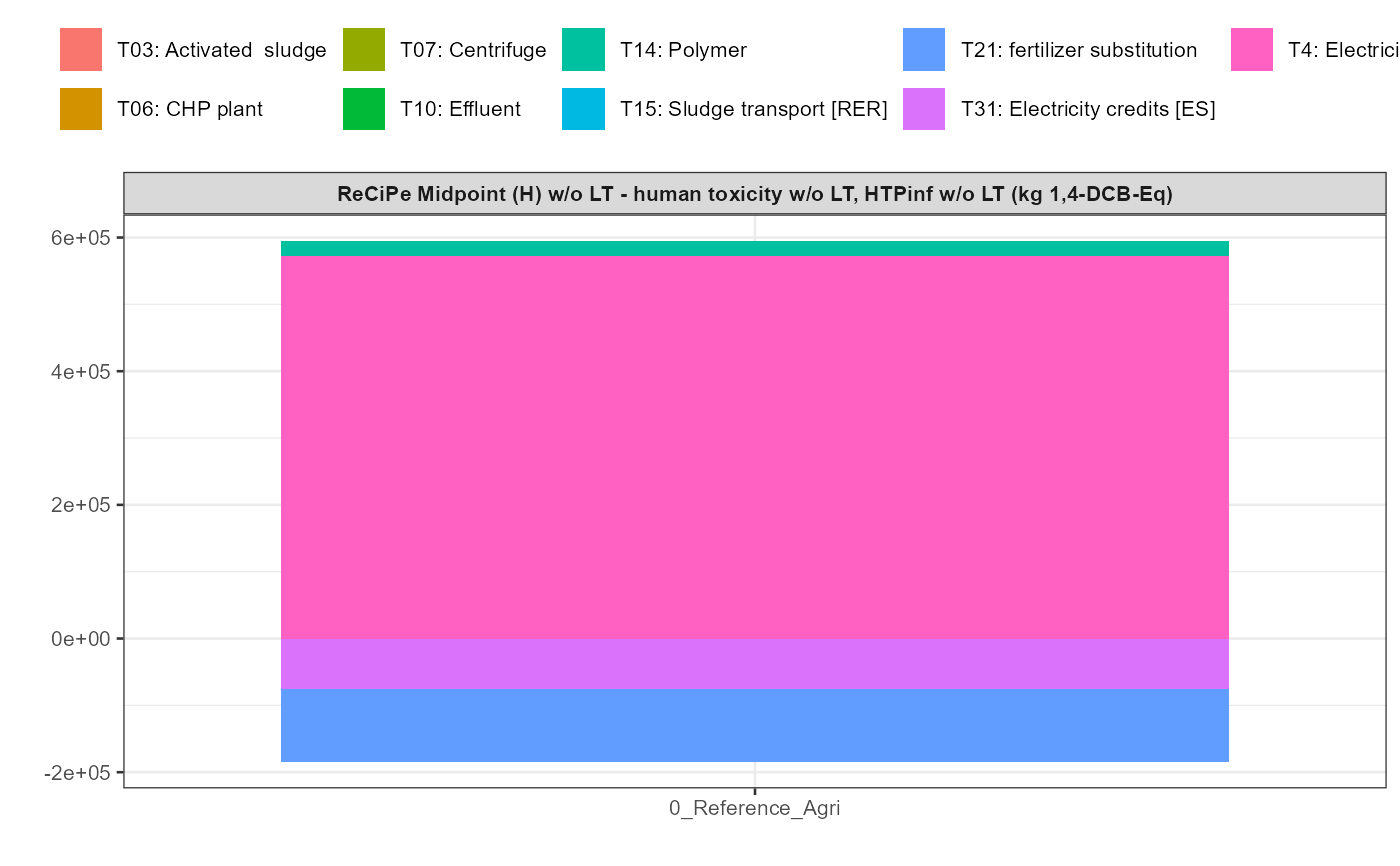
kwb.umberto::plot_results(grouped_data = umberto10_data_grouped)
umberto10_csv_dir <- system.file("extdata/umberto-lca+_v10.1.0.3.146",
package = "kwb.umberto")
umberto10_rawdata <- kwb.umberto::import_rawdata(csv_dir = umberto10_csv_dir)
#> Importing csv file 'D:/a/_temp/Library/kwb.umberto/extdata/umberto-lca+_v10.1.0.3.146/smartech2_model-v0.1.0_input-v0.3.1.csv'
#> ℹ Using "','" as decimal and "'.'" as grouping mark. Use `read_delim()` for more control.
#> Rows: 8456 Columns: 15
#> ── Column specification ────────────────────────────────────────────────────────
#> Delimiter: ";"
#> chr (14): Project, Model, Net, Timestamp, Product, Product Name, Product Arr...
#> dbl (1): Quantity
#>
#> ℹ Use `spec()` to retrieve the full column specification for this data.
#> ℹ Specify the column types or set `show_col_types = FALSE` to quiet this message.
umberto10_data_grouped <- kwb.umberto::group_data(umberto10_rawdata)
kwb.umberto::plot_results(grouped_data = umberto10_data_grouped)