Plot Filled Areas below Curve Lines using ggplot
plot_curve_areas_gg(x = seq_along(y_list[[1]]), y_list, col = NULL,
  stack = FALSE, legend = TRUE, line_colour = "black")
Arguments
| x | x positions of each curve given in |
|---|---|
| y_list | list of vectors of y positions each of which must be as long as
|
| col | vector of the same length as |
| stack | if |
| legend | if |
| line_colour | colour of the curve lines |
Examples
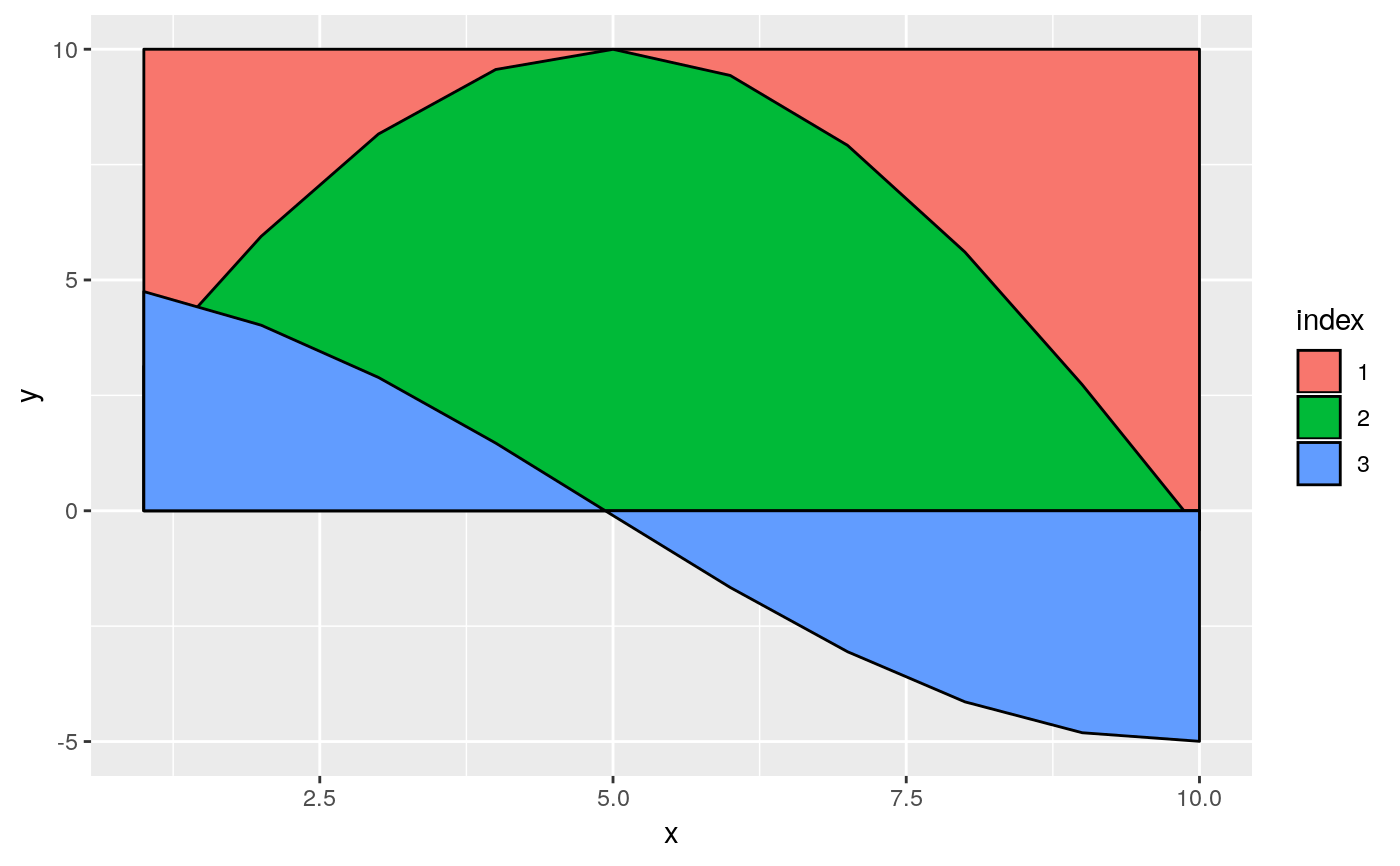
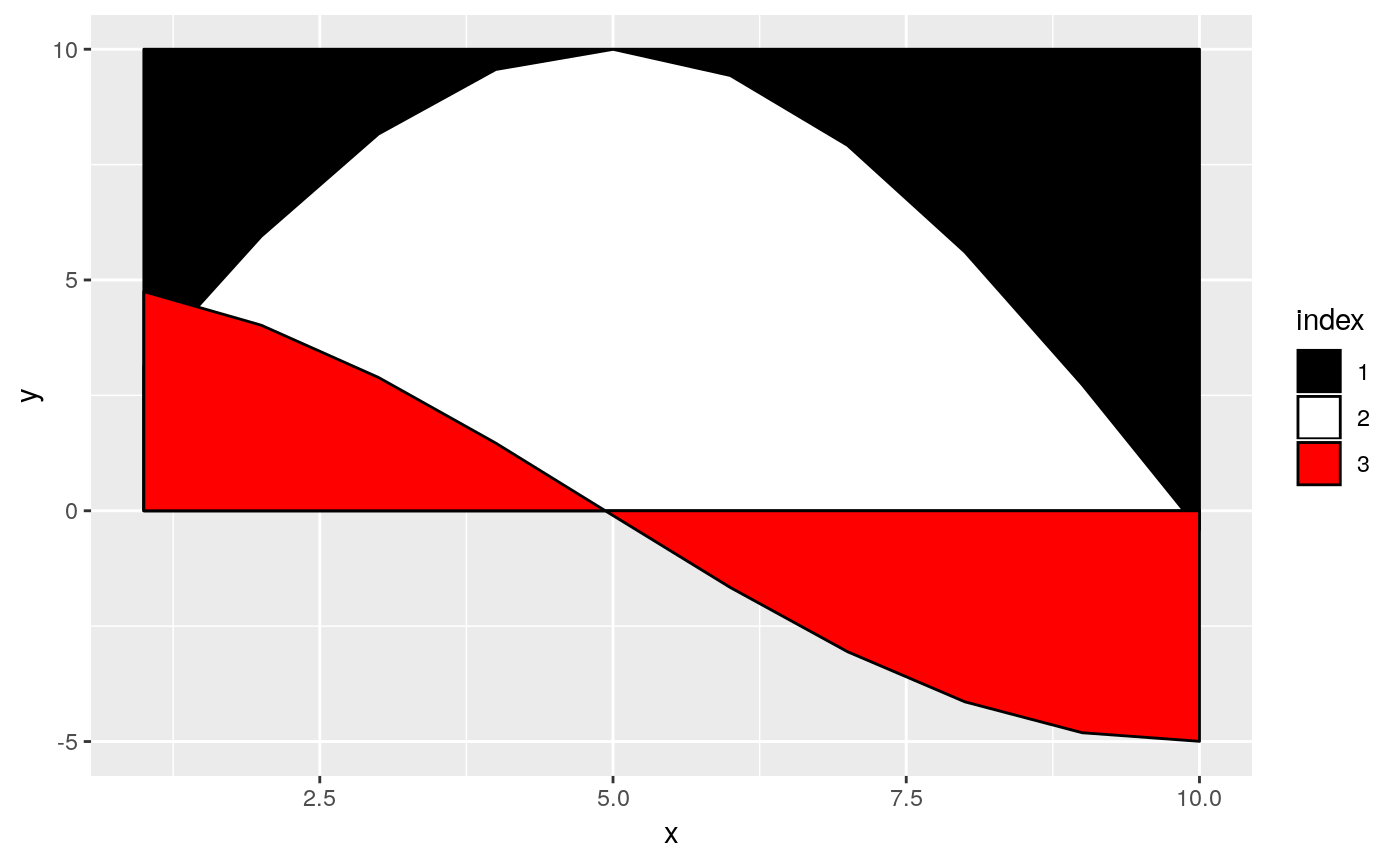
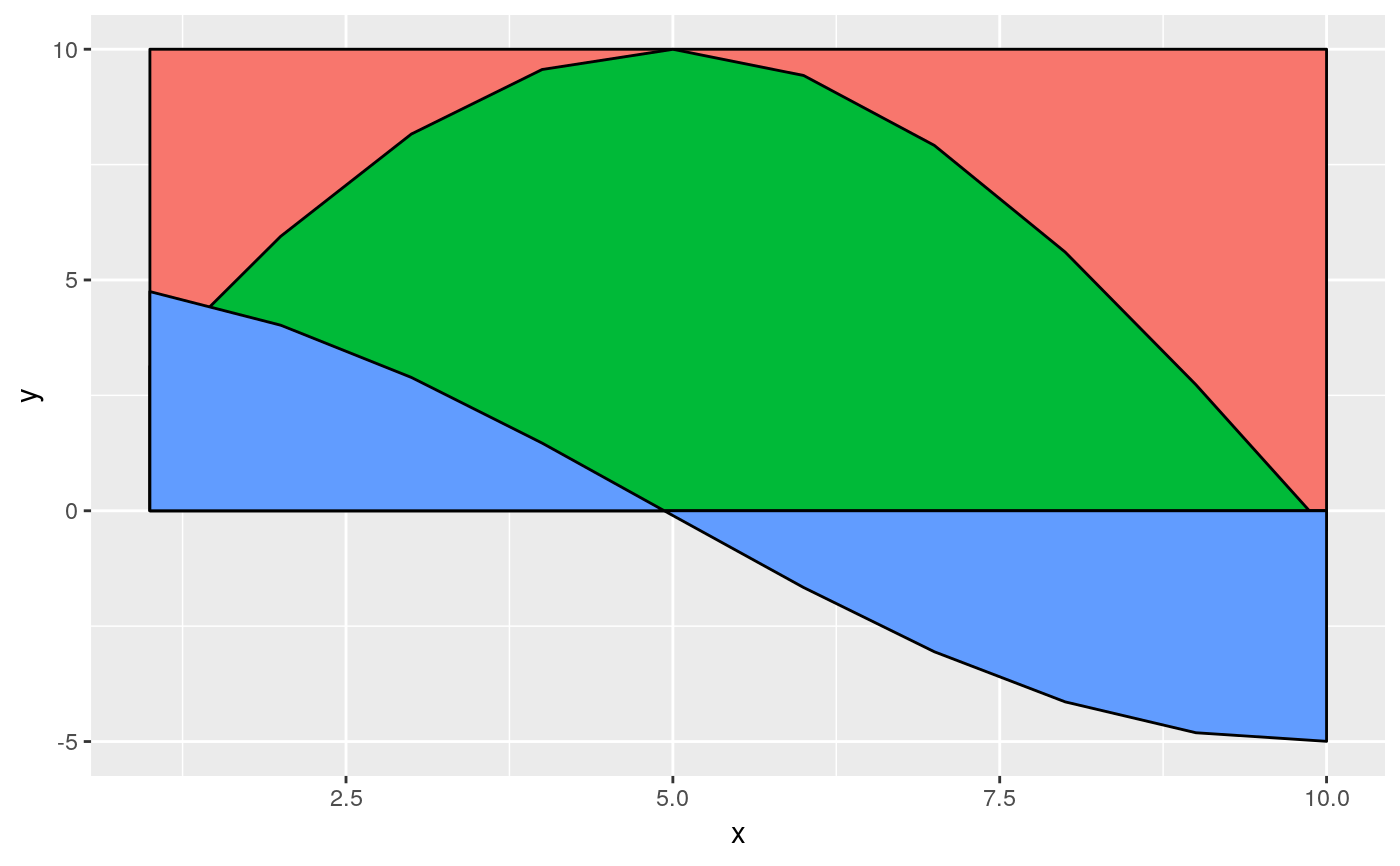
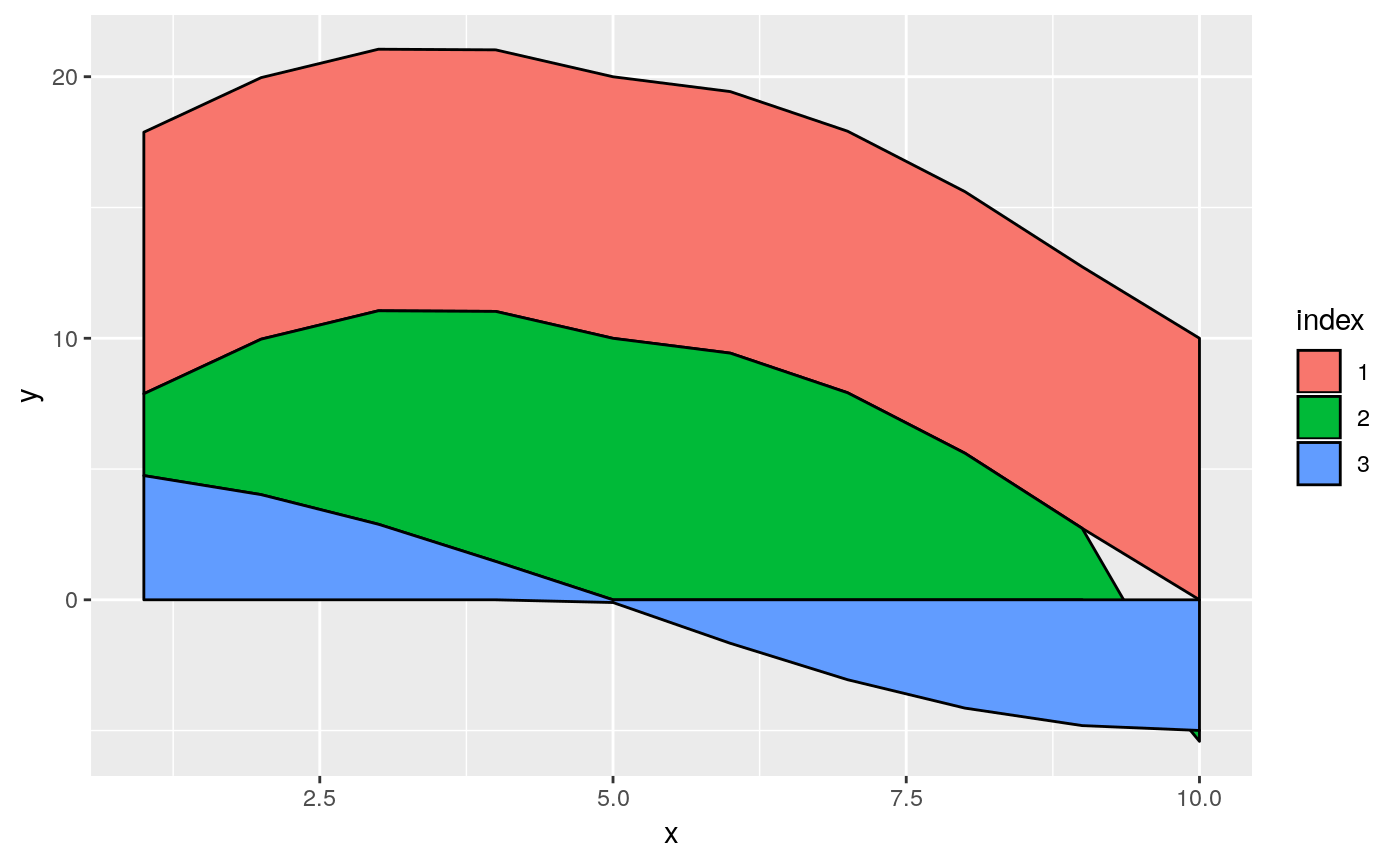
x <- 1:10 y_list <- list(rep(10, 10), 10*sin(x/pi), 5*cos(x/pi)) # Basic plot plot_curve_areas_gg(x, y_list)# Set the colours (must be as many as vectors in y_list) plot_curve_areas_gg(x, y_list, col = c("black", "white", "red"))# Hide the legend plot_curve_areas_gg(x, y_list, legend = FALSE)# Stack the values instead of overlaying them plot_curve_areas_gg(x, y_list, stack = TRUE)


