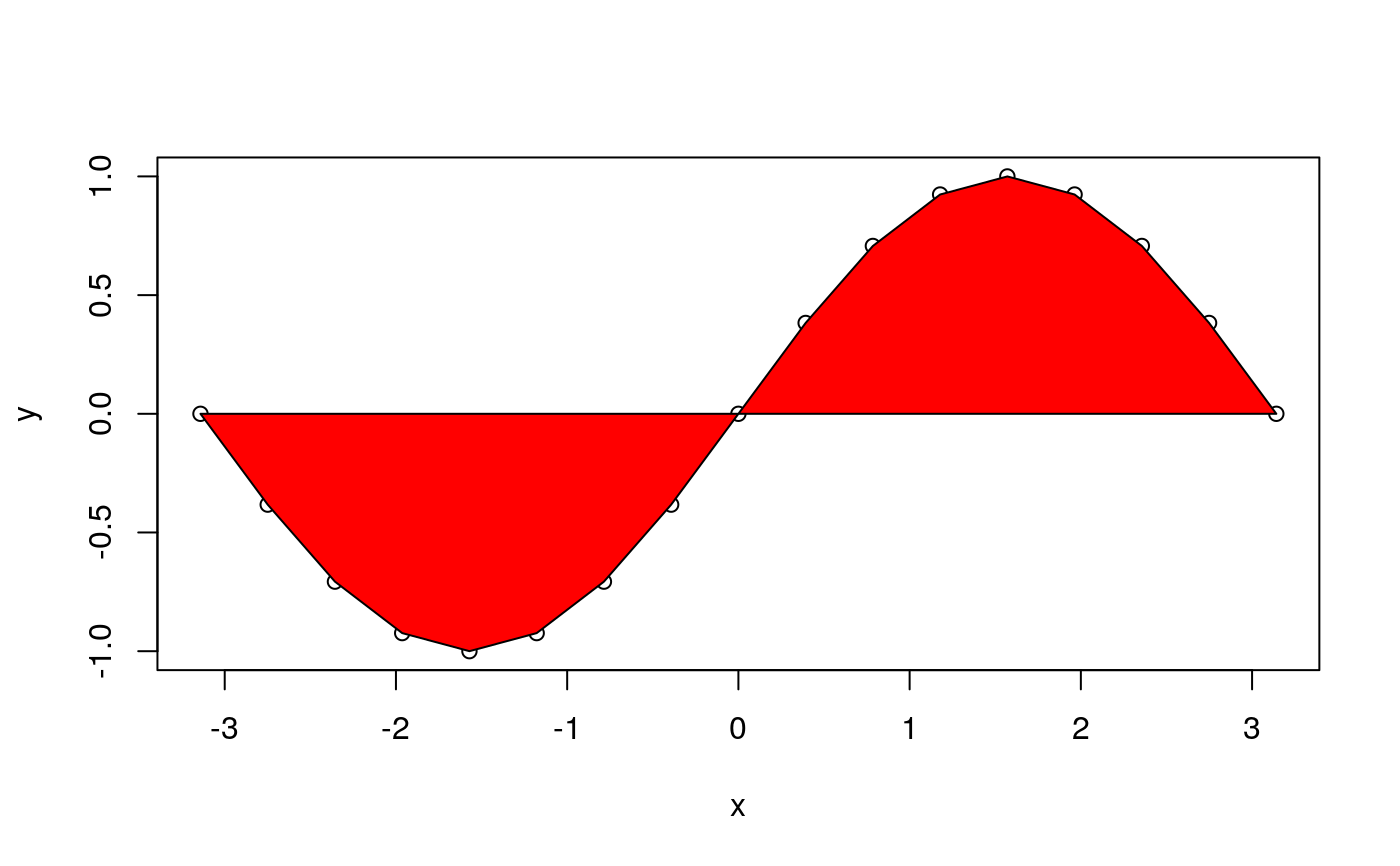
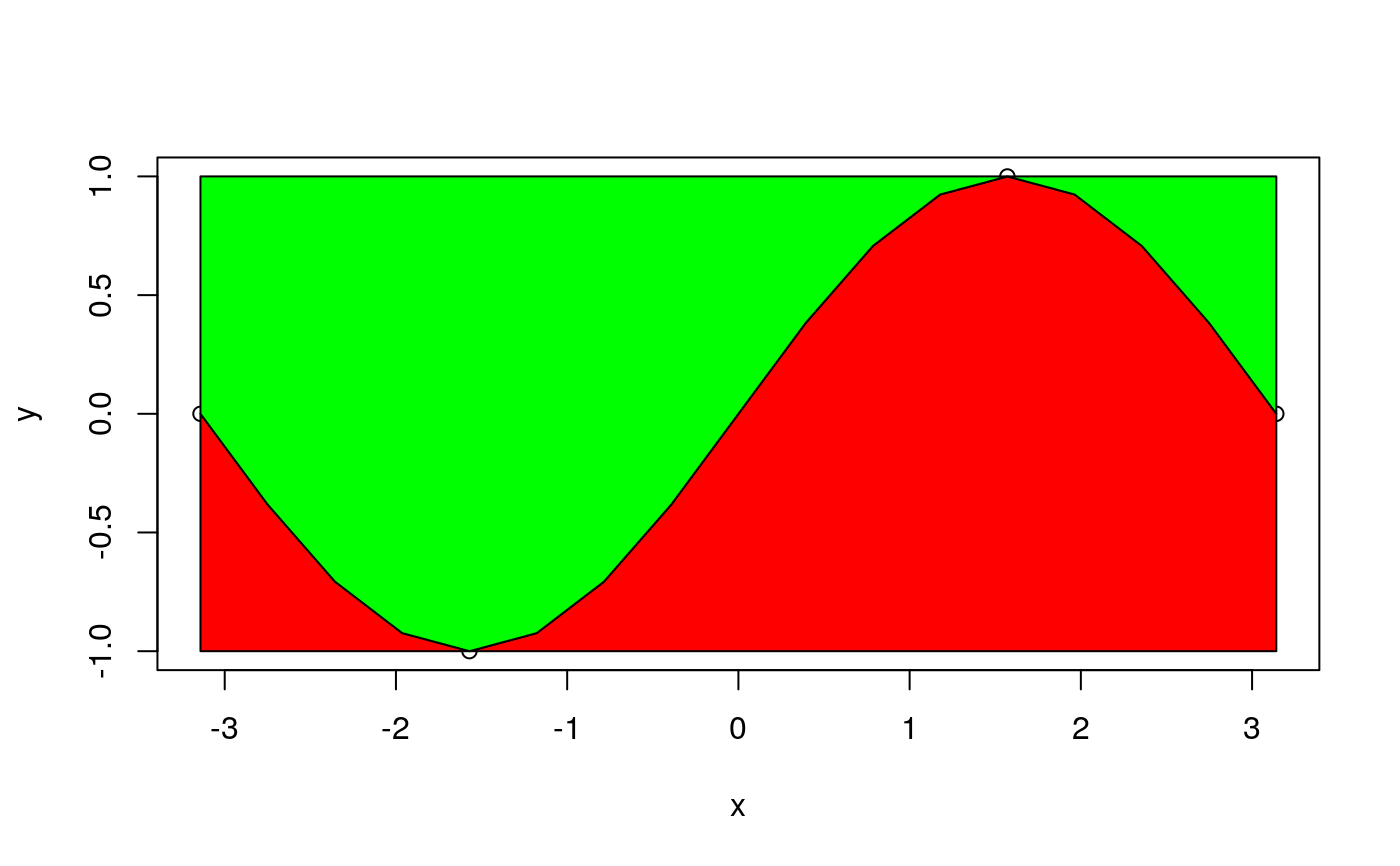
Plot Filled Area Below a Curve Line
plot_curve_area(x, y, y.base = 0, col = NA, ...)
Arguments
| x | vector of x coordinates |
|---|---|
| y | vector of y coordinates |
| y.base | y coordinate of horizontal line that closes the area |
| col | colour of area to be plotted. Default: NA |
| … | further arguments given to polygon such as |
Examples
x <- seq(-pi, pi, pi/8) y <- sin(x) plot(x, y)plot_curve_area(x, y, 0, col = "red")plot(x, y)plot_curve_area(x, y, -1, col = "red")plot_curve_area(x, y, 1, col = "green")