For combinations of columns c1 and c2 in data,
ggplot-objects are generated each of which shows the number (relative =
FALSE) or percentage (relative = TRUE) of the different possible
combinations of values in c1, and c2. The combinations of
column names are created from the permutation of column names given in
vars_1 and vars_2, respectively.
plotLevelFrequencies(data, vars_1 = NULL, vars_2 = NULL,
  relative = TRUE)
Arguments
| data | data frame |
|---|---|
| vars_1 | first vector of column names |
| vars_2 | second vector of column names |
| relative | if |
Value
list of objects of class "ggplot"
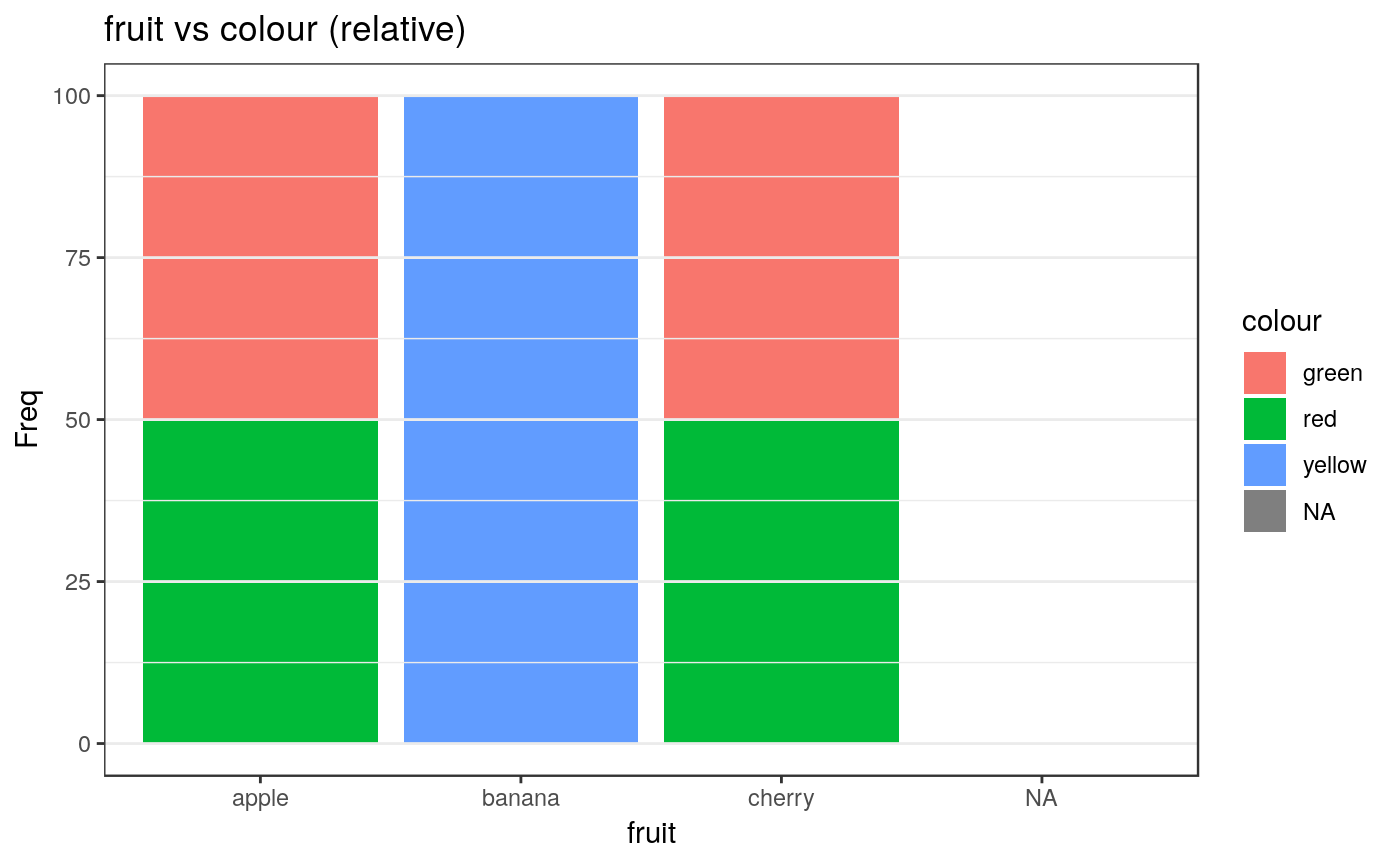
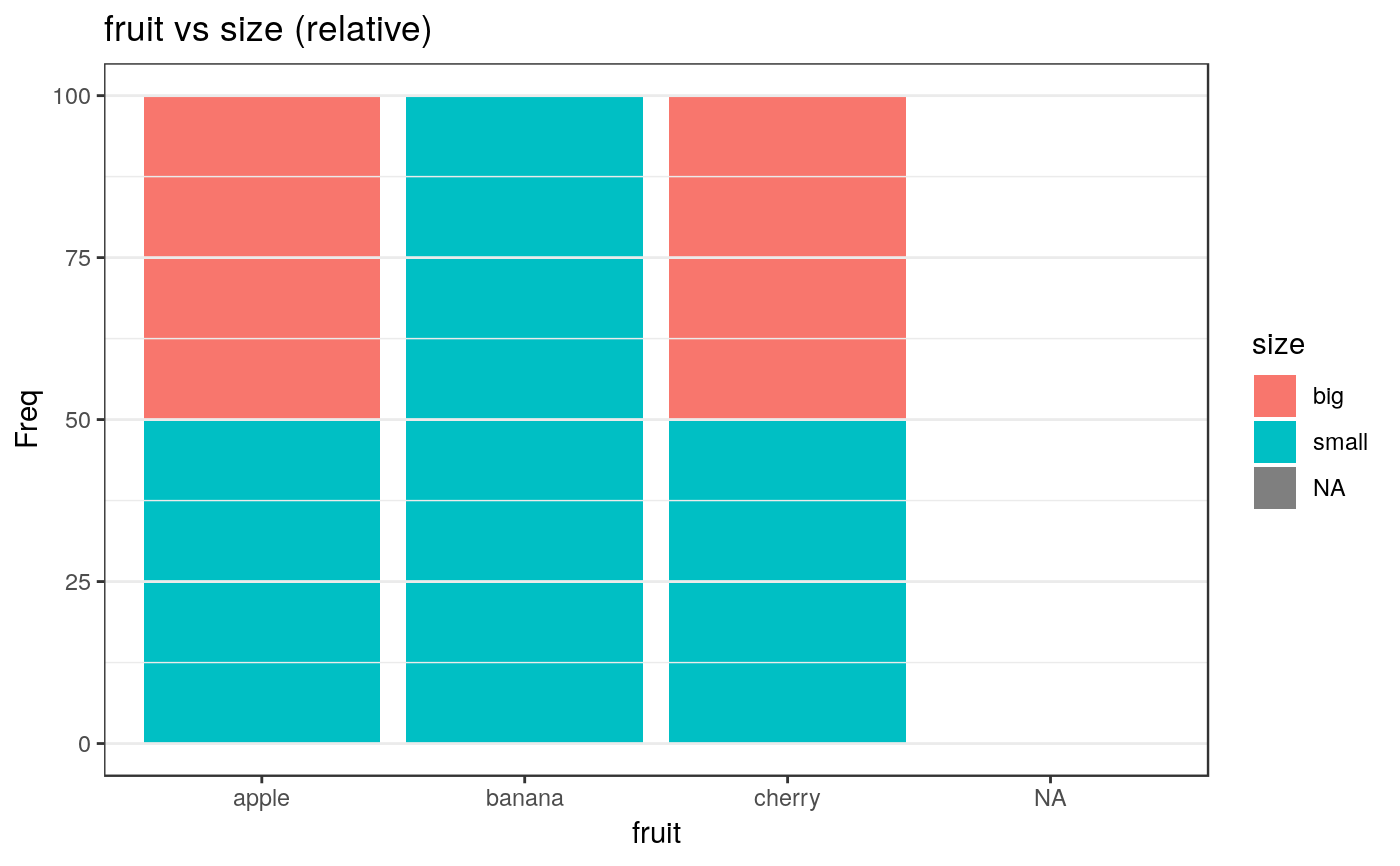
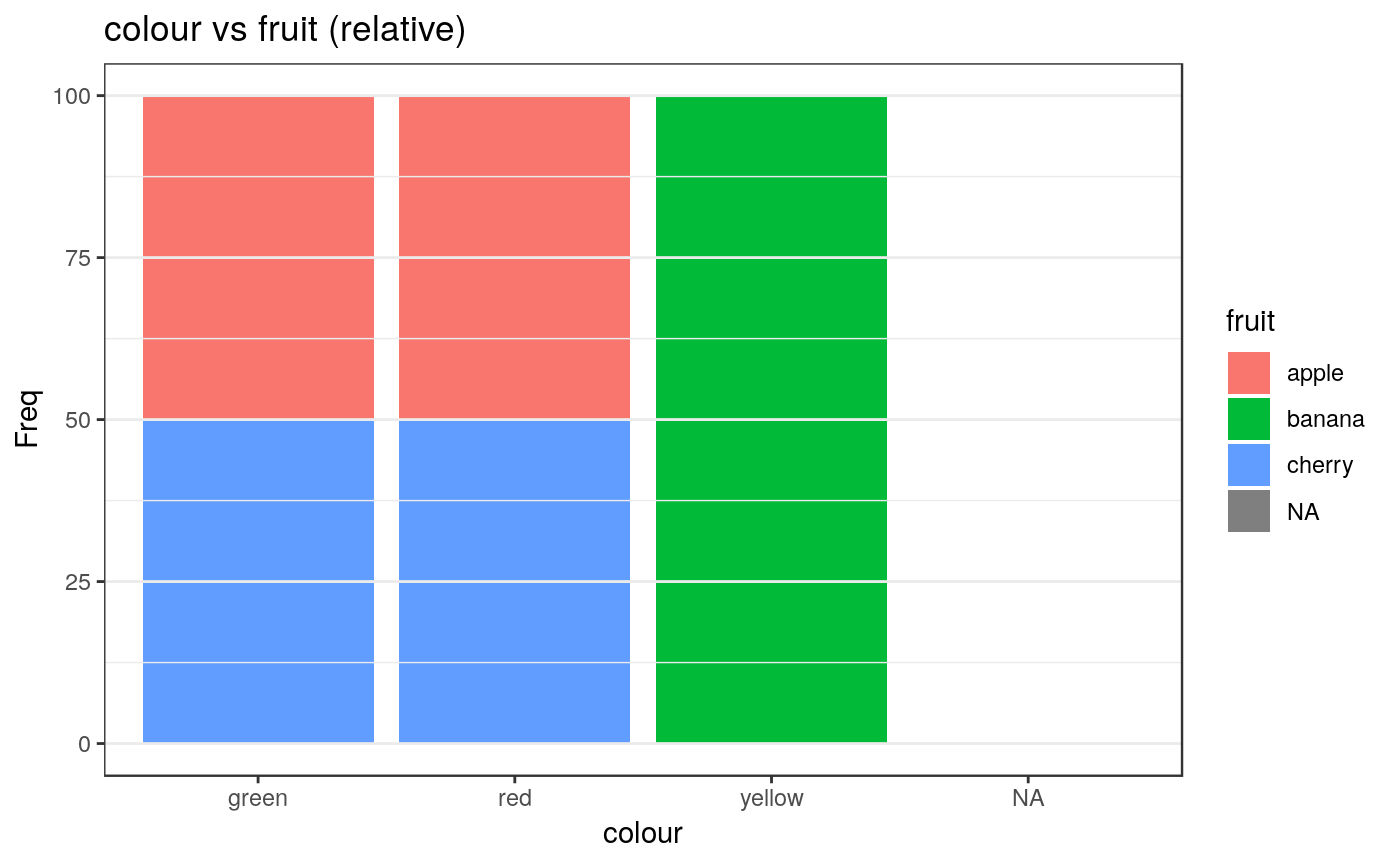
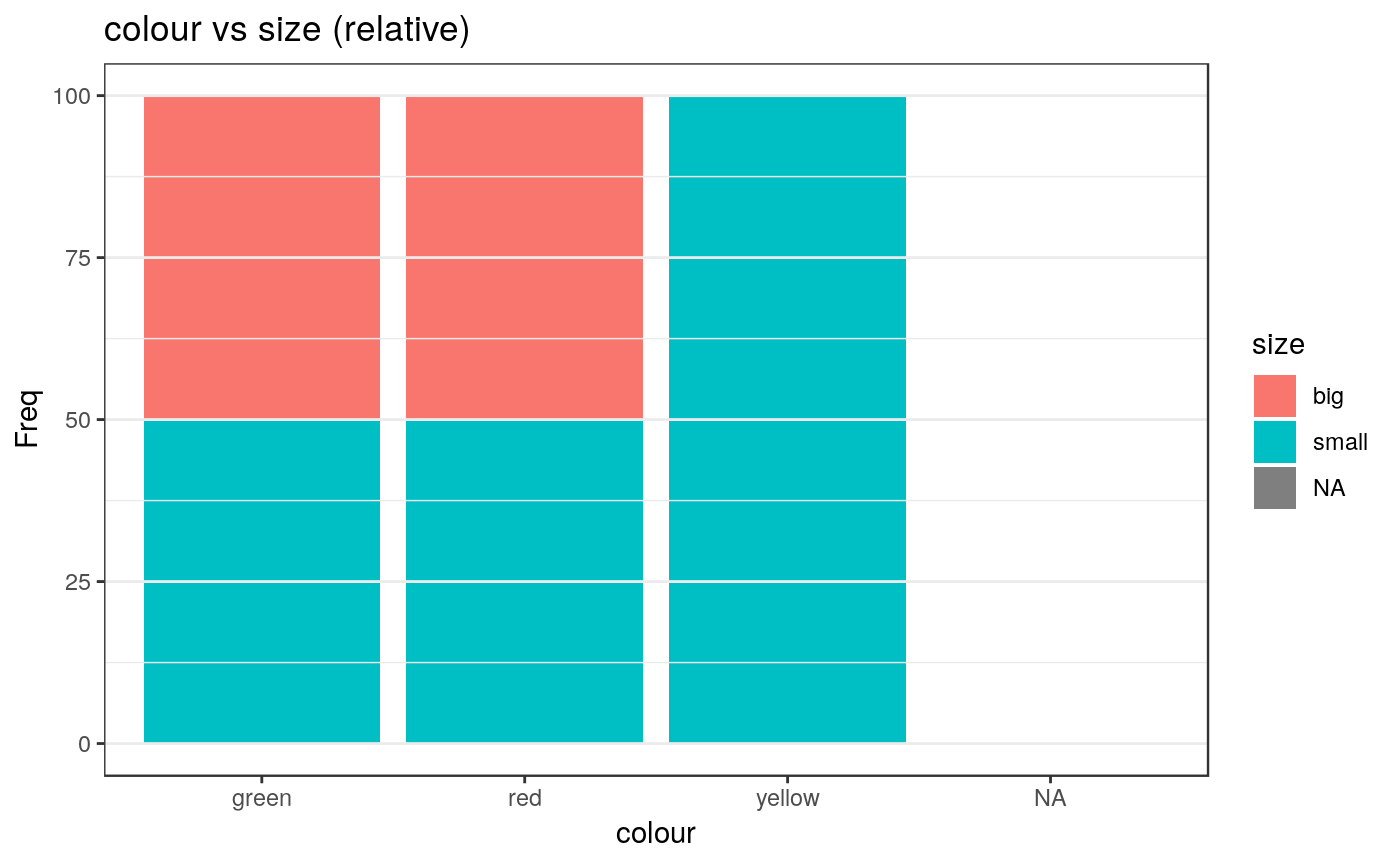
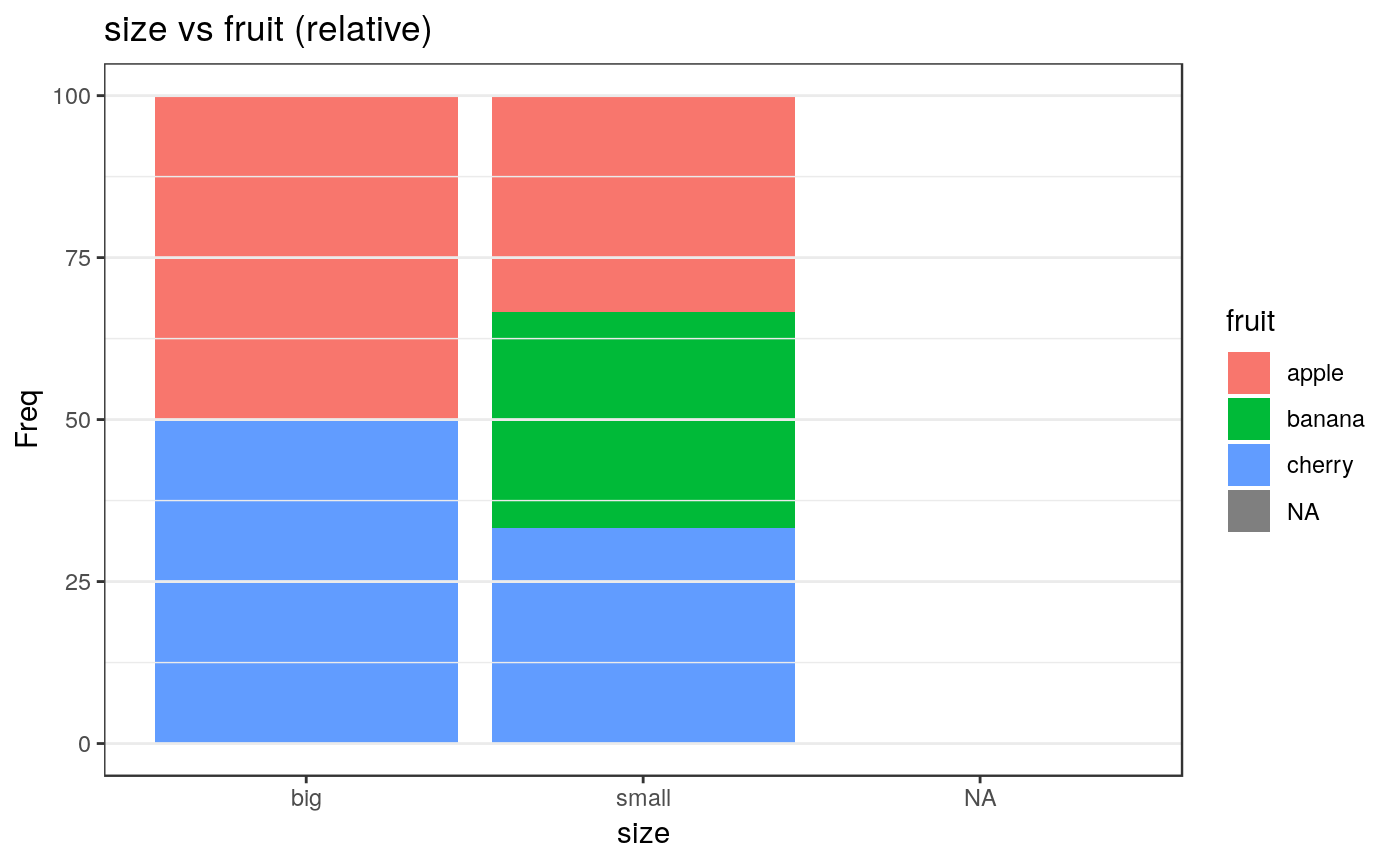
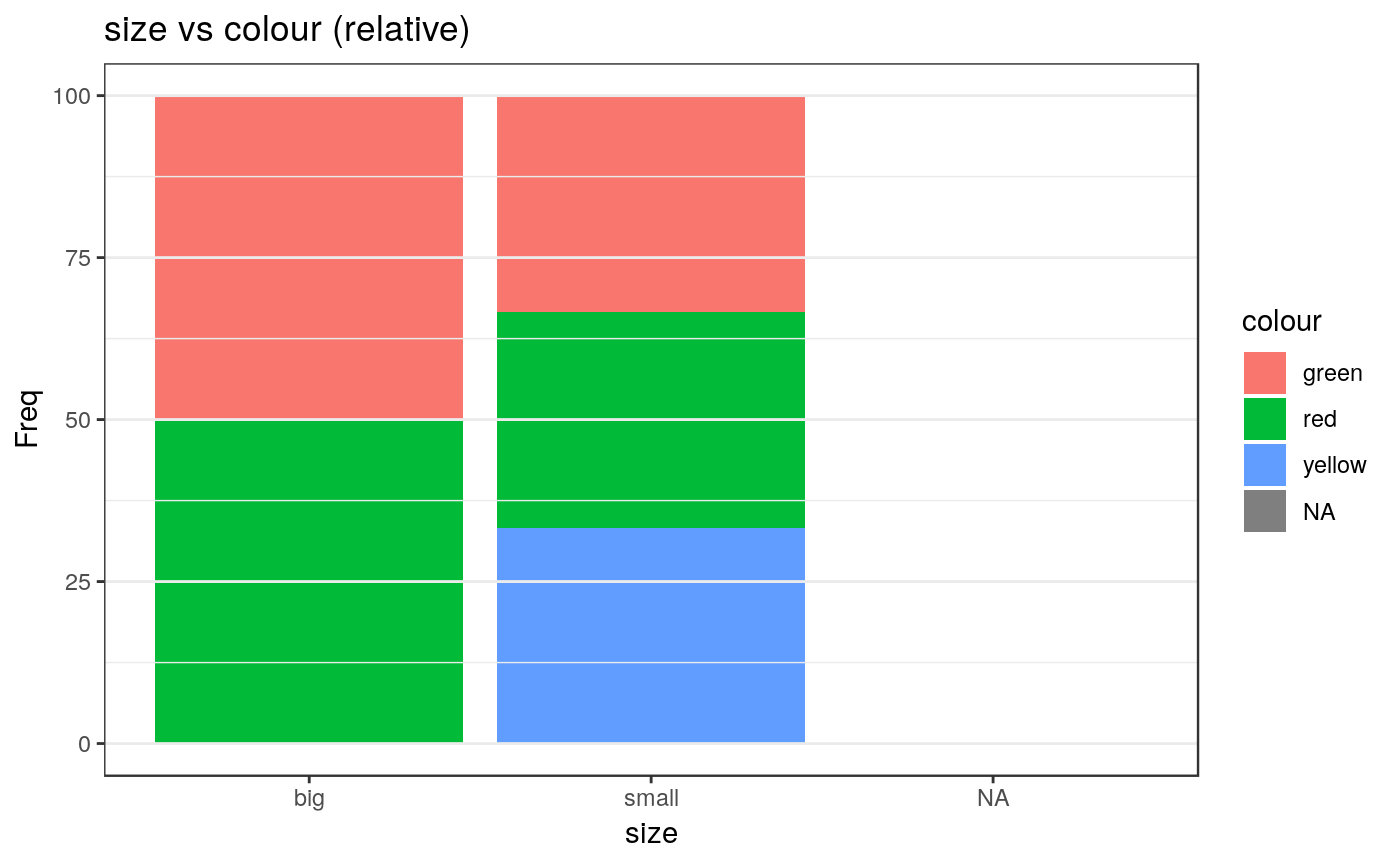
Examples
data <- data.frame(
  fruit = c("apple", "cherry", "apple", "banana", "cherry"),
  colour = c("green", "red", "red", "yellow", "green"),
  size = c("small", "small", "big", "small", "big")
)

plotLevelFrequencies(data)#> $rel__fruit_vs_colour#>
#> $rel__fruit_vs_size#>
#> $rel__colour_vs_fruit#>
#> $rel__colour_vs_size#>
#> $rel__size_vs_fruit#>
#> $rel__size_vs_colour#>