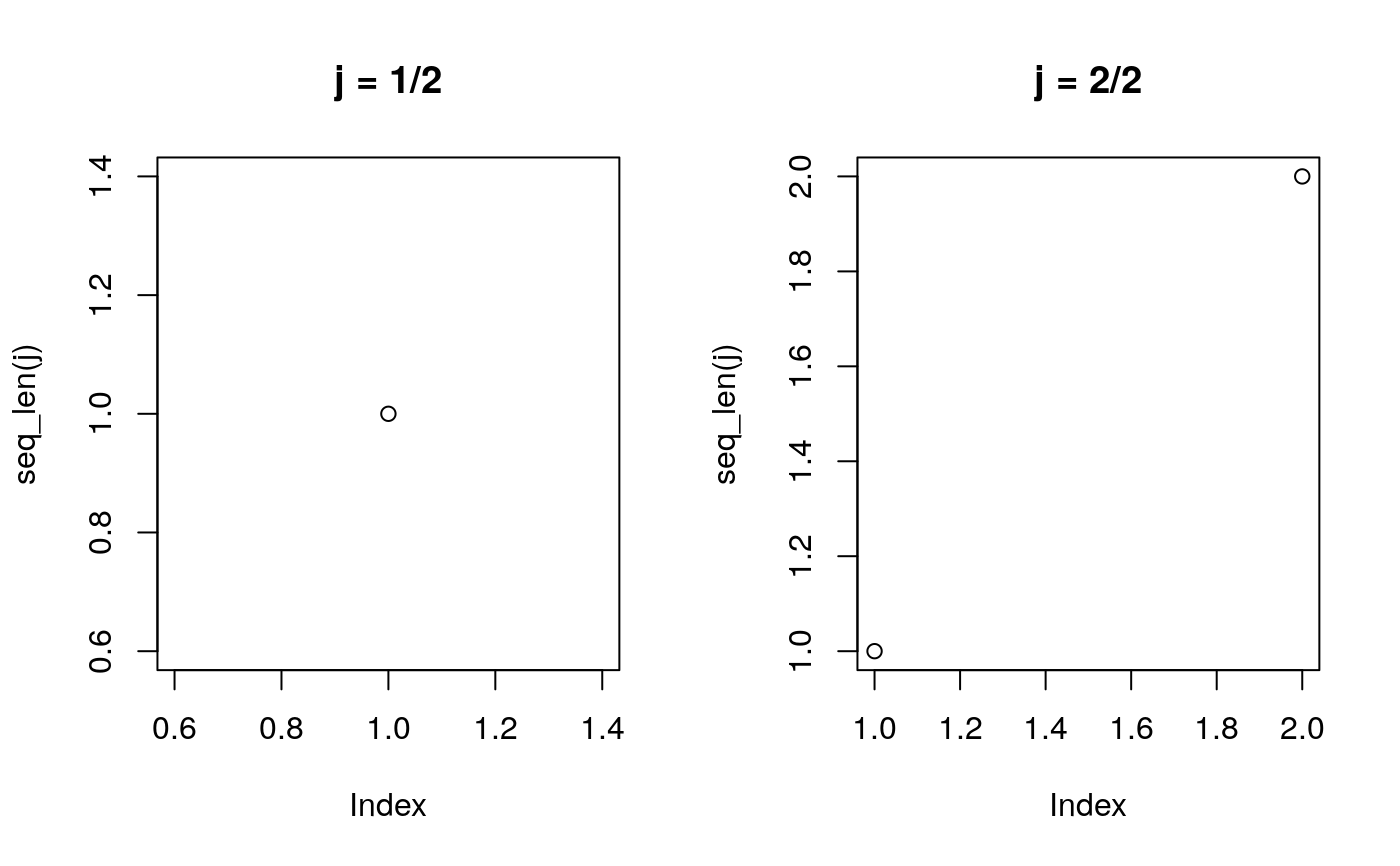
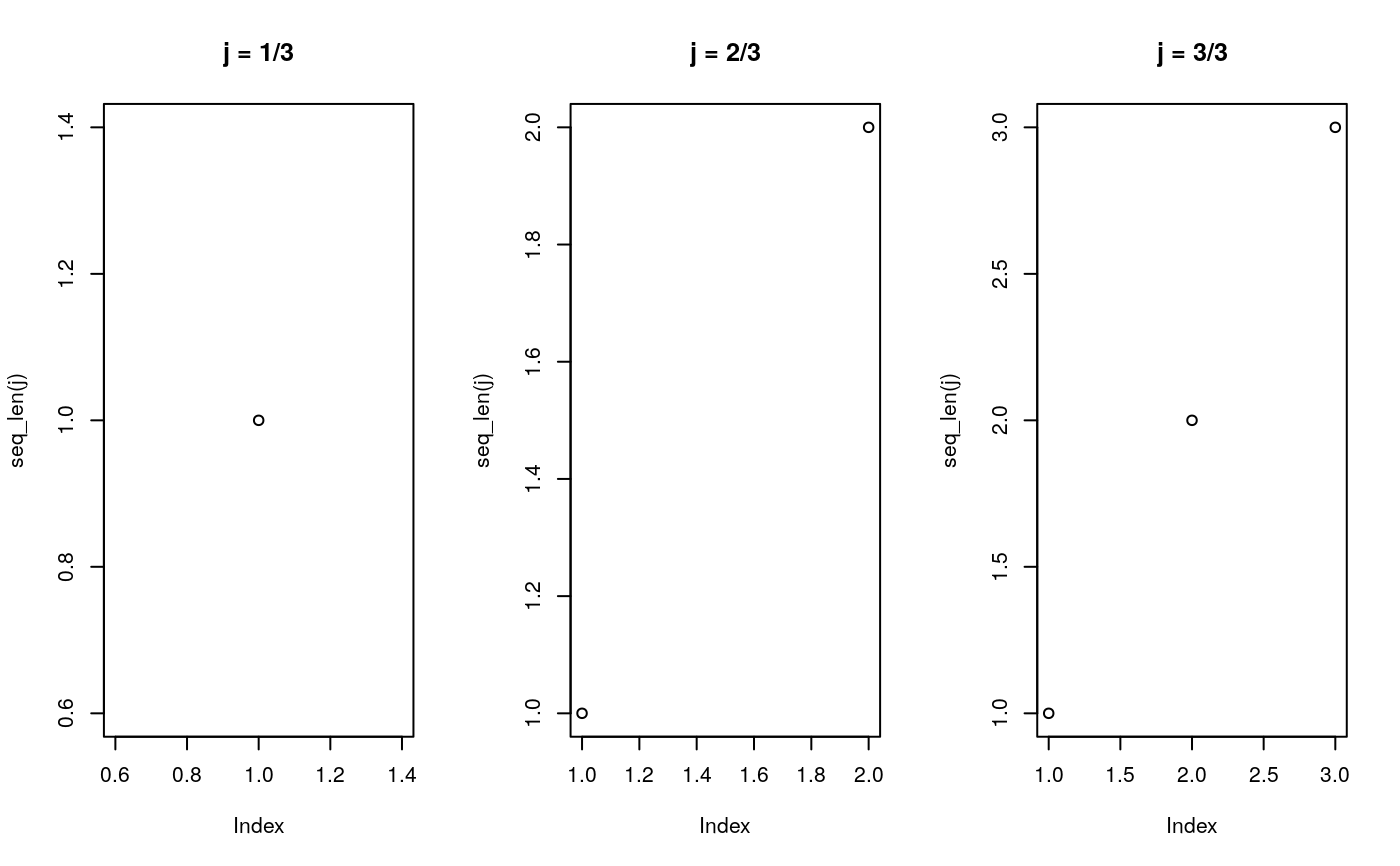
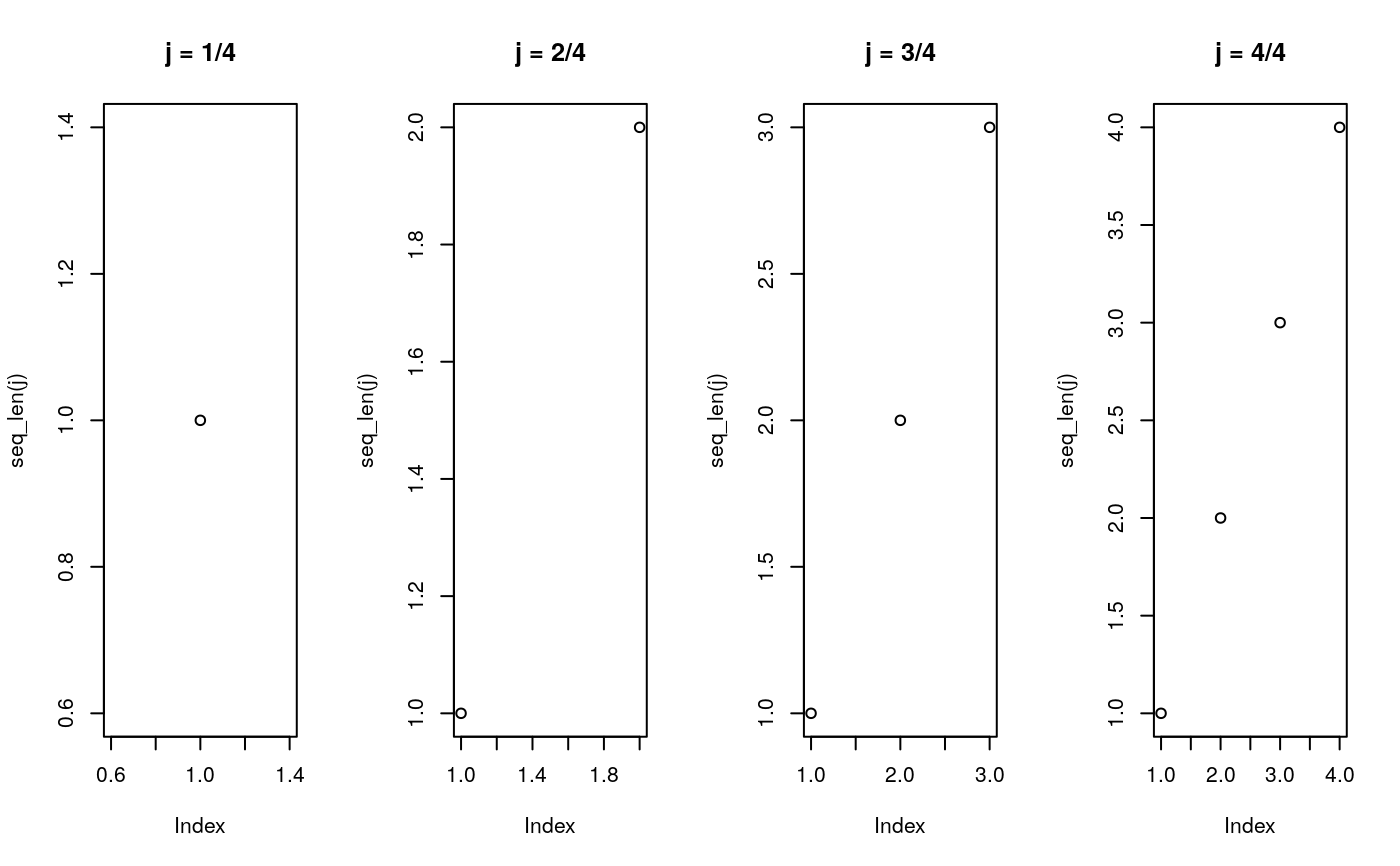
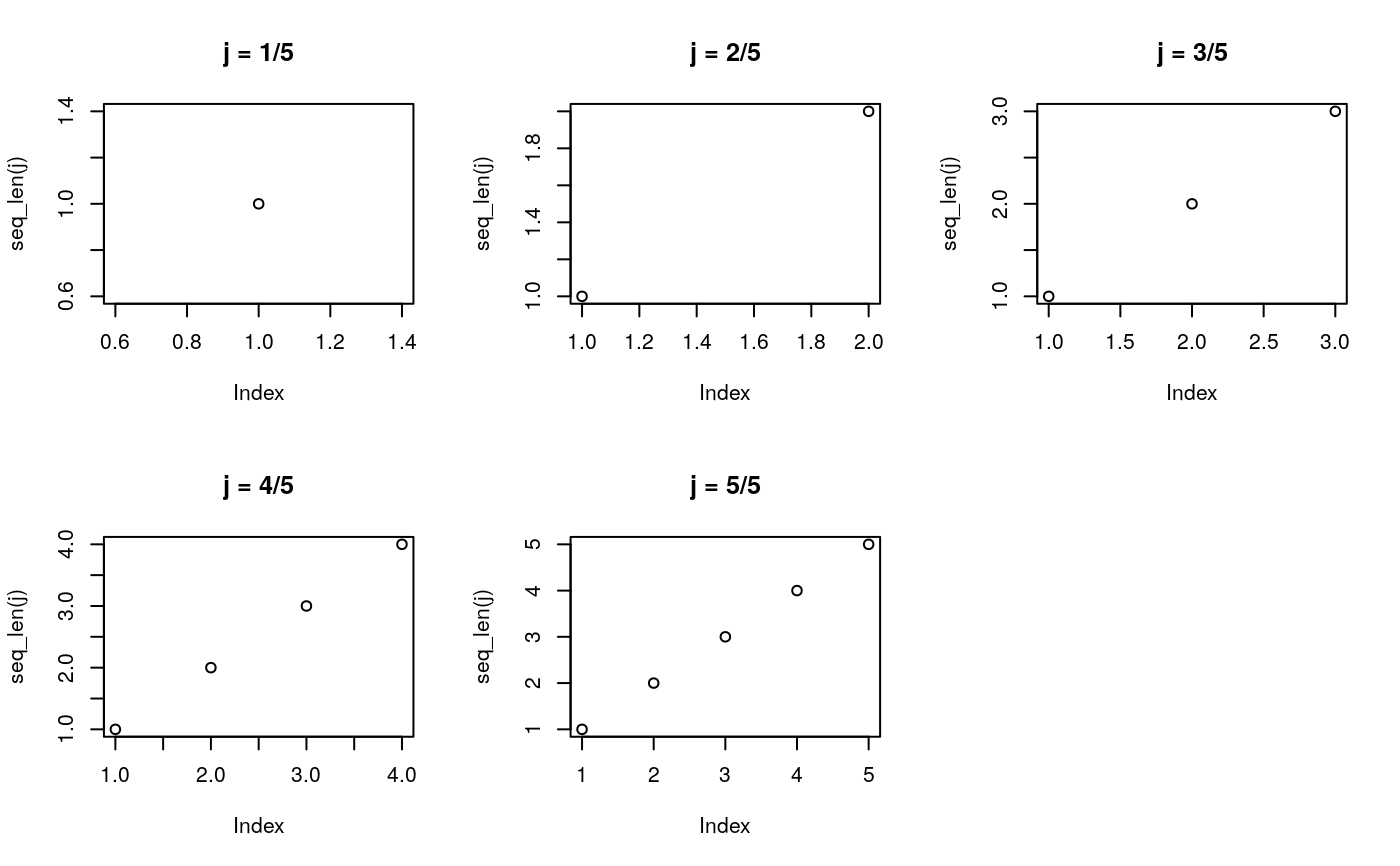
Number of rows and columns in an optimal plot grid for n plots
bestRowColumnSetting(n, target.ratio = 1)
Arguments
| n | number of plots to be placed in a matrix of equally sized plot cells |
|---|---|
| target.ratio | desired height/width ratio within each plot (ignoring margins). Default: 1 |
Value
named vector of two elements with the first element (nrow)
representing the number of rows and the second element (ncol)
representing the number of columns for an optimal plot grid to be used for
n plots in the current plot region
Examples
# save current graphical parameter setting old.par <- graphics::par(no.readonly = TRUE) for (i in 2:5) { graphics::par(mfrow = kwb.plot::bestRowColumnSetting(i)) for (j in 1:i) { plot(seq_len(j), main = paste0("j = ", j, "/", i)) } }