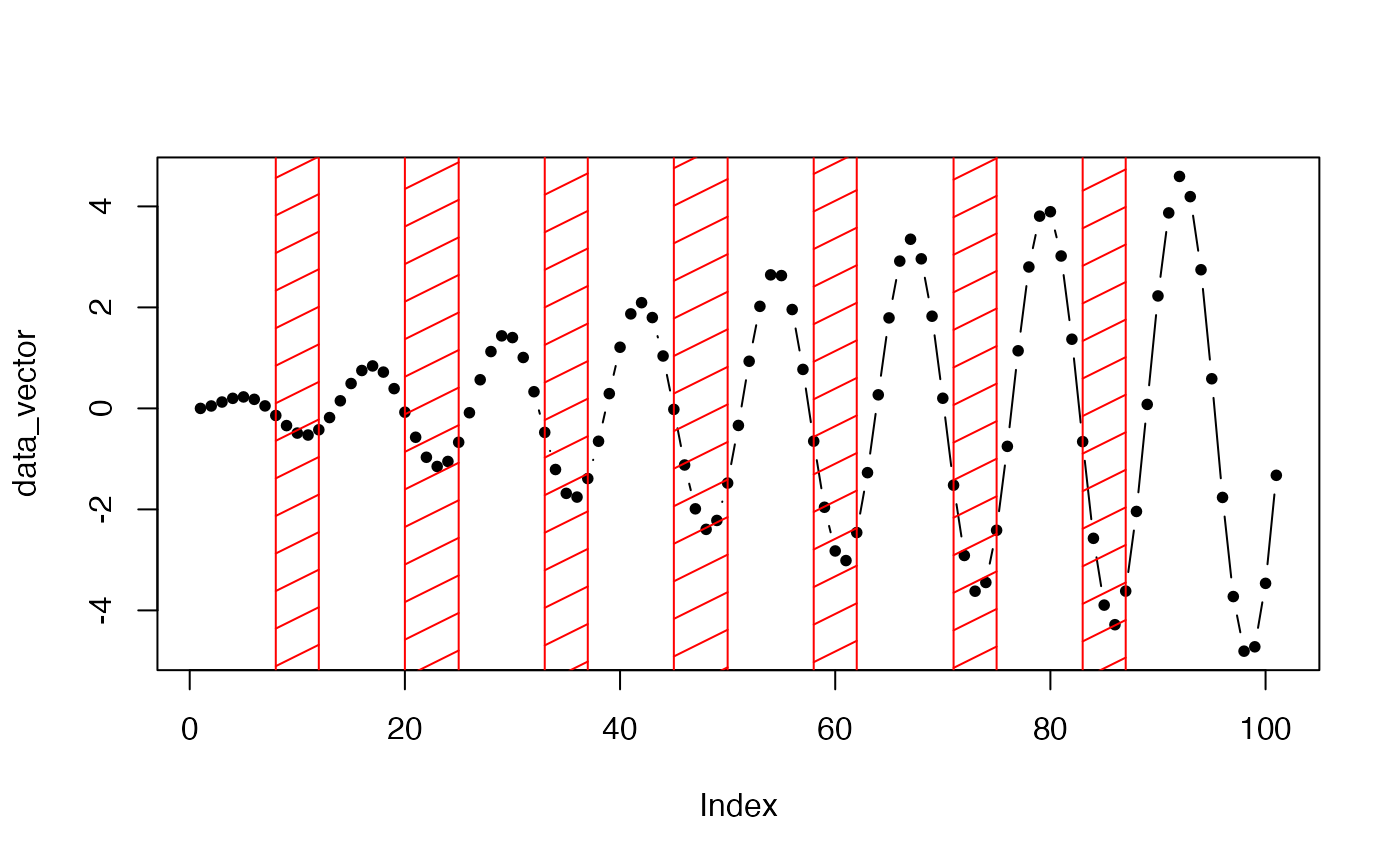
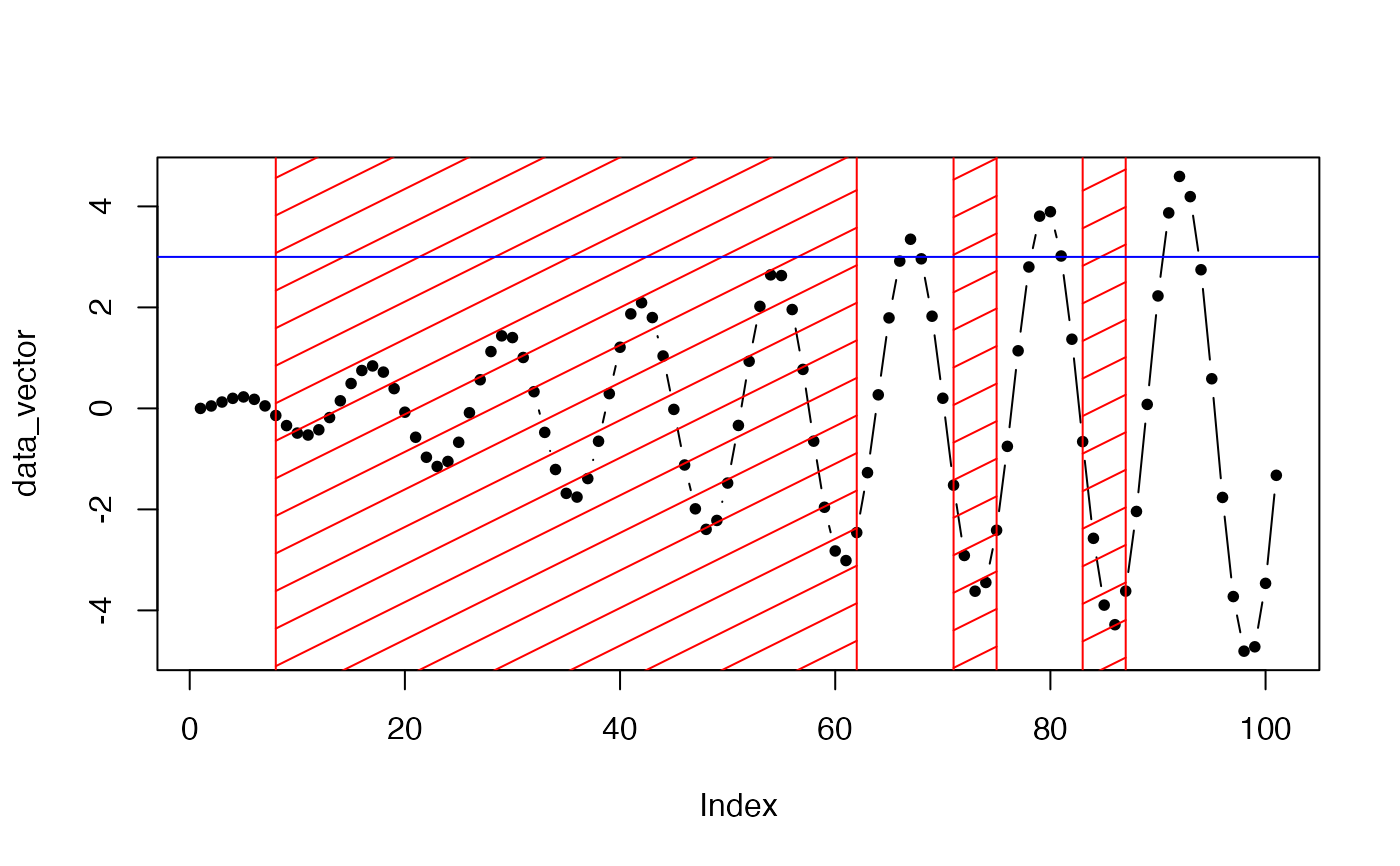
Counts the Number of intervals where x number of data points in a row are below a predifined threshold value. Events are separated by a specified number of data points above that threshod value. Furthermore, the exceedance of a value can also seperation critirion.
count_def_events(
  data_vector,
  starting_data_points,
  threshold,
  separating_data_points,
  use_recovery_value = FALSE,
  recovery_value = NULL,
  return_event_positions = FALSE
)
Arguments
- data_vector
Numeric vector (with data in the same unit as the tjreshold)
- starting_data_points
Minimal number of data points to define the beginning of an deficiency event
- threshold
Numeric in the same unit as the data vector
- separating_data_points
Minimal number of data points to seperate two events
- use_recovery_value
If TRUE a recovery, two events are only separated if a revocvery value is exceeded between two deficits
- recovery_value
Numeric in the same unit as the data vector. Only used if use_recovery_value = TRUE.
- return_event_positions
Instead the number of events, the events starting and endpositions are returned, correspoding to the data vector
Value
Either a number of events or a data frame with event start and end position
Examples
data_vector <- sin(x = seq(0,50,0.5)) * 1:101/20

a <- count_def_events(
data_vector = data_vector,
starting_data_points = 2,
threshold = 0,
separating_data_points = 4,
use_recovery_value = FALSE,
recovery_value = 7,
return_event_positions = TRUE)

plot(data_vector, pch = 20, type = "b")
rect(xleft = a$tBeg, xright = a$tEnd, ybottom = -10, ytop = 10,
 col = "red", density = 4)


recovery_value <- 3
a <- count_def_events(
data_vector = data_vector,
starting_data_points = 2,
threshold = 0,
separating_data_points = 4,
use_recovery_value = TRUE,
recovery_value = recovery_value,
return_event_positions = TRUE)

plot(data_vector, pch = 20, type = "b")
rect(xleft = a$tBeg[a$start],
 xright = a$tEnd[a$end],
 ybottom = -10, ytop = 10,
 col = "red", density = 4)
 abline(h = recovery_value, col = "blue")
