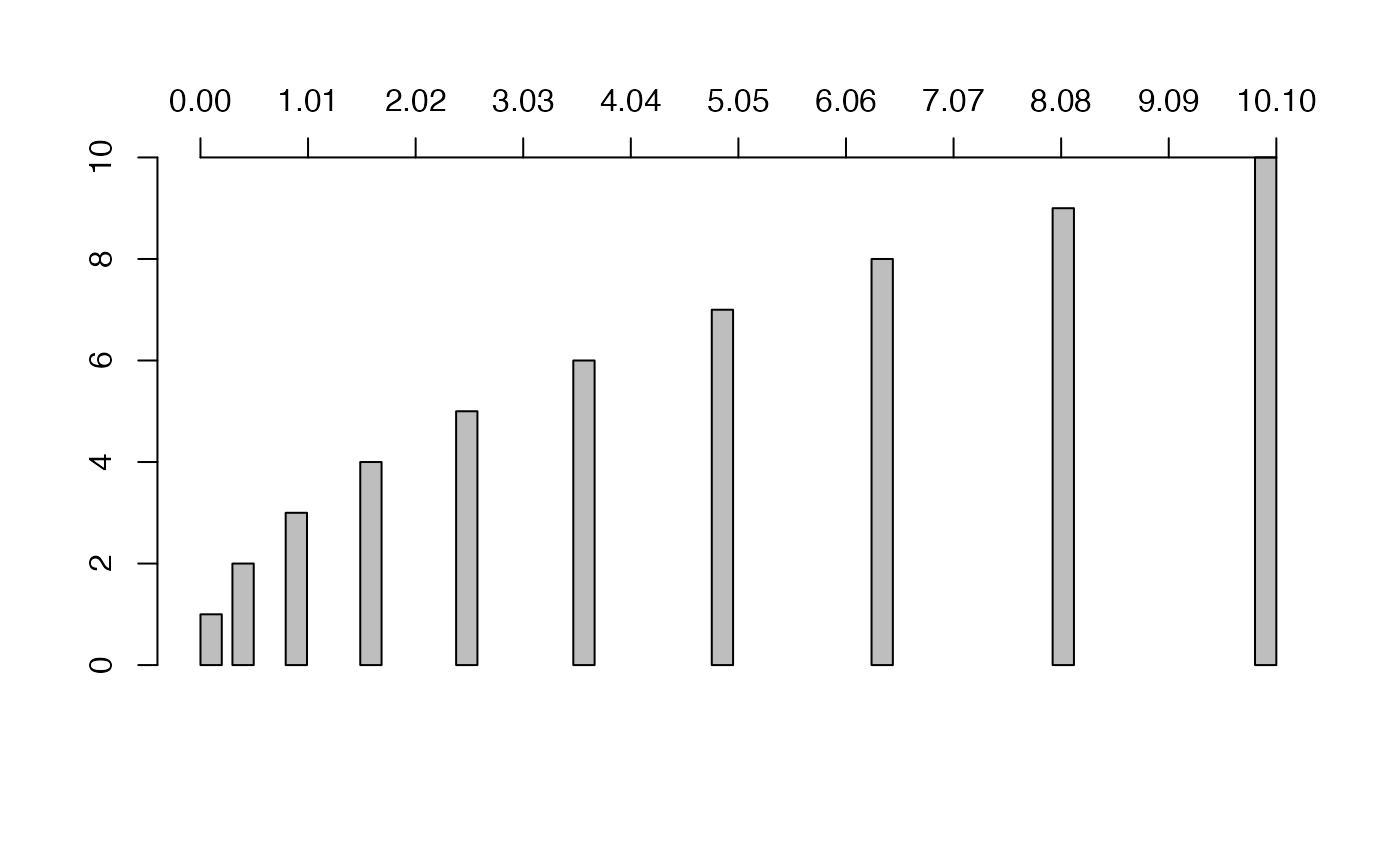
Extended version of R barplot function, enabling x positioning of the bars.
hsBarplot(
  myHeight,
  myWidth = 1,
  myPosition = NULL,
  myXlim = NULL,
  myBeside = FALSE,
  myReverse = FALSE,
  myInnerSpace = 0,
  myAxis = TRUE,
  dbg = FALSE,
  myYlim = NULL,
  myValLabs = FALSE,
  ...
)
Arguments
- myHeight
Vector or matrix containing the bar heights, see R's barplot function.
- myWidth
Bar widths. If bars are to be stacked (isp = NULL, see below) w represents the widths of the stacked bars. If bars shall be plotted side by side instead of stacked (isp >= 0) w represents the widths of the bars within one and the same bar group. Corresponding bars of different groups will always have the same width.
- myPosition
Vector containing the x-positions of the bars/bar groups.
- myXlim
Vector containing minimum and maximum x-value to be shown in the plot.
- myBeside
If TRUE, bars within a bar group are arranged side by side instead of stacked.
- myReverse
If TRUE, the bars in the plot will reverted, i.e. they will be arranged according to decreasing x-values.
- myInnerSpace
"Inner" space between bars of the same bar group (only relevant if y is a matrix and not a vector). If NULL, bars of the same bar group will be stacked
- myAxis
whether to draw an axis or not
- dbg
whether to print debug messages or not
- myYlim
ylim vector
- myValLabs
whether to put value labels on top of the bars
- ...
further arguments passed to
barplot
Examples
hsBarplot(1:10, myWidth = 0.2, myPosition = 0.1 * c(1:10)^2)
